. 2015 Mar 18;85(6):1257-72.
doi: 10.1016/j.neuron.2015.02.020. Epub 2015 Mar 5.

Pentraxins coordinate excitatory synapse maturation and circuit integration of parvalbumin interneurons

Affiliations

Pentraxins coordinate excitatory synapse maturation and circuit integration of parvalbumin interneurons

Kenneth A Pelkey et al. Neuron. .

Erratum in

Abstract

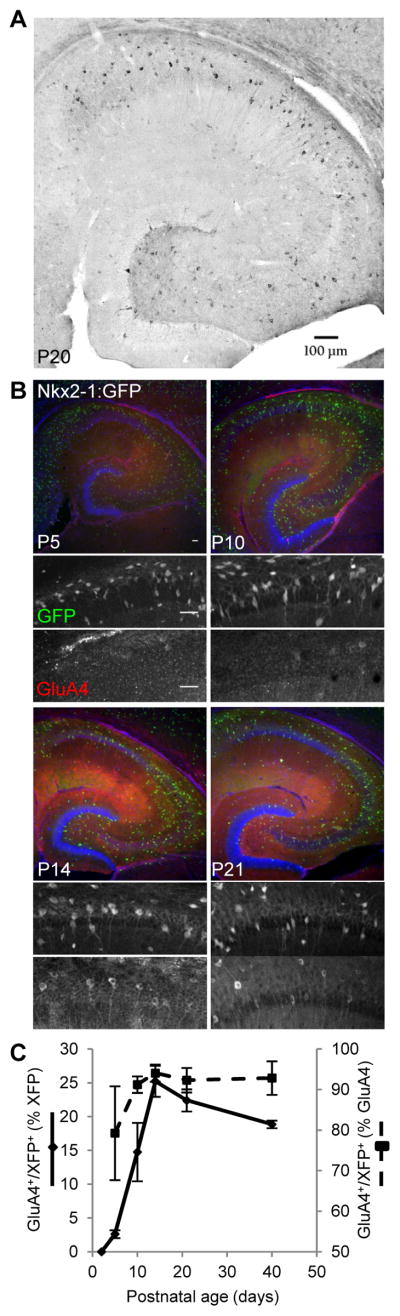
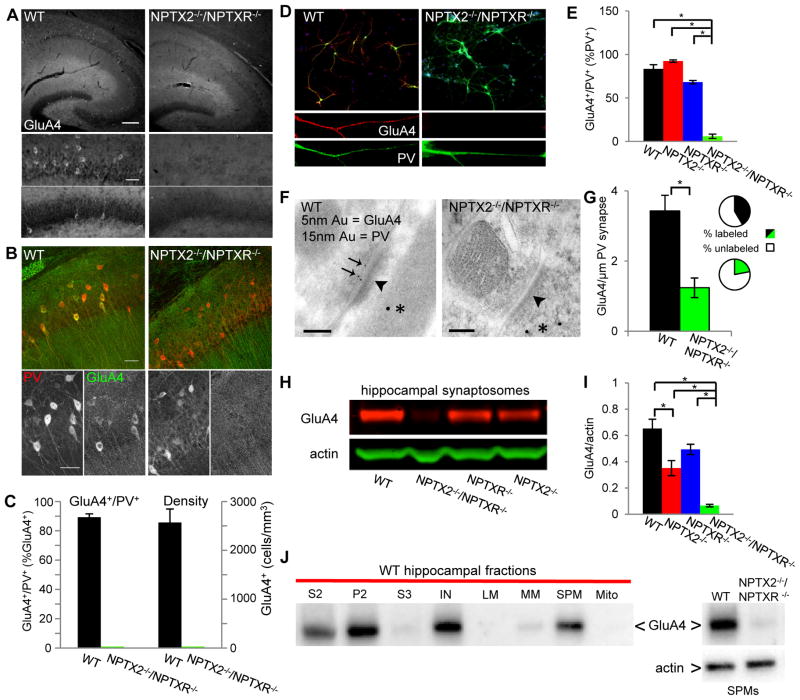
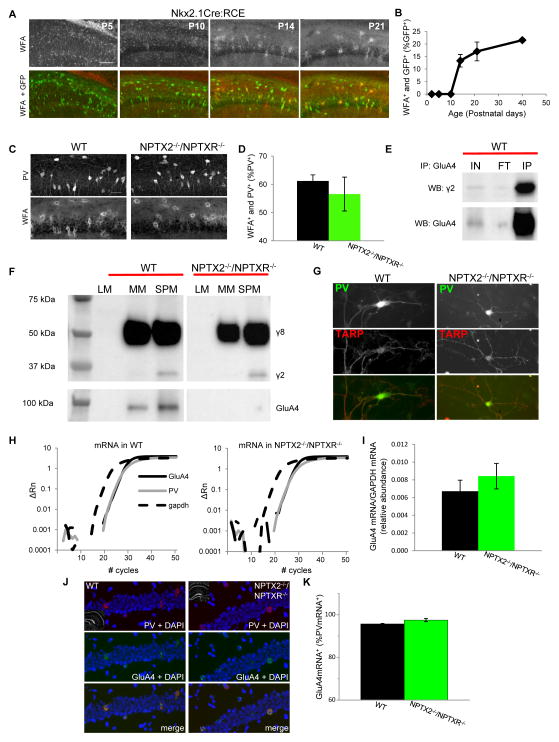
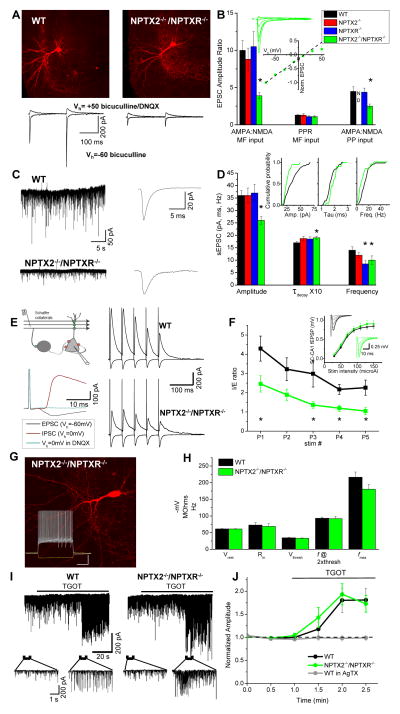
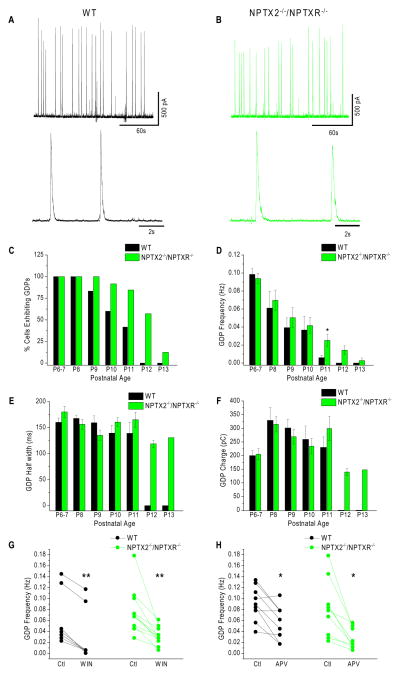
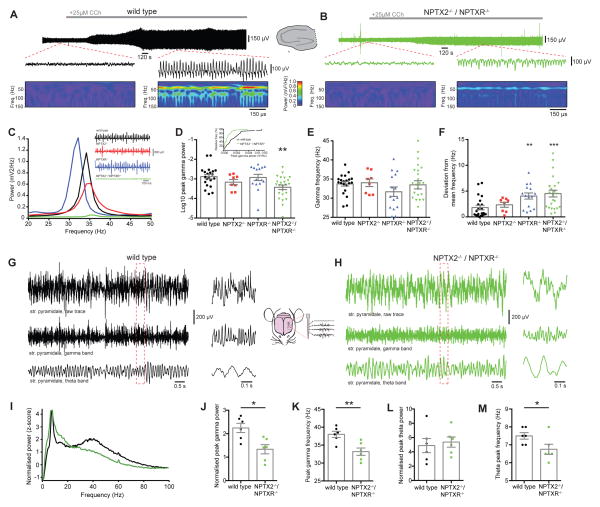
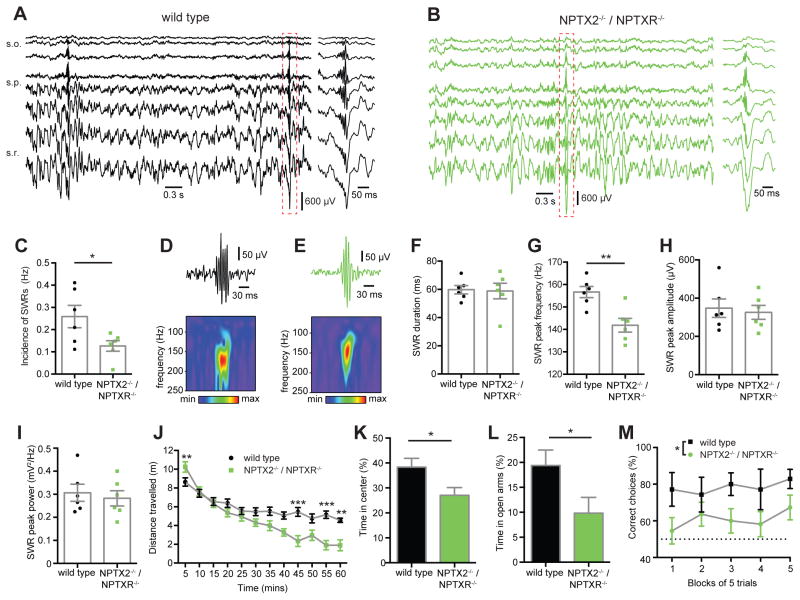
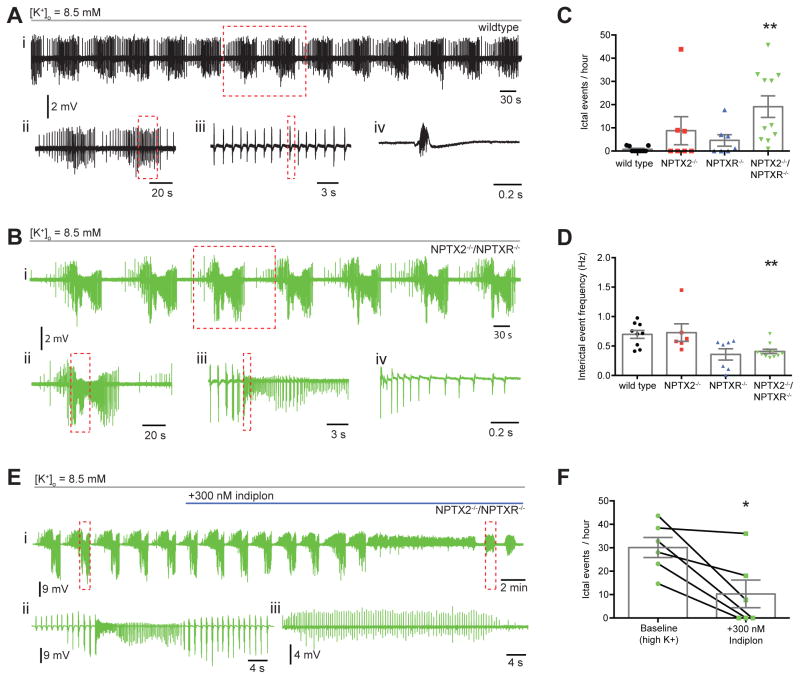
Circuit computation requires precision in the timing, extent, and synchrony of principal cell (PC) firing that is largely enforced by parvalbumin-expressing, fast-spiking interneurons (PVFSIs). To reliably coordinate network activity, PVFSIs exhibit specialized synaptic and membrane properties that promote efficient afferent recruitment such as expression of high-conductance, rapidly gating, GluA4-containing AMPA receptors (AMPARs). We found that PVFSIs upregulate GluA4 during the second postnatal week coincident with increases in the AMPAR clustering proteins NPTX2 and NPTXR. Moreover, GluA4 is dramatically reduced in NPTX2(-/-)/NPTXR(-/-) mice with consequent reductions in PVFSI AMPAR function. Early postnatal NPTX2(-/-)/NPTXR(-/-) mice exhibit delayed circuit maturation with a prolonged critical period permissive for giant depolarizing potentials. Juvenile NPTX2(-/-)/NPTXR(-/-) mice display reduced feedforward inhibition yielding a circuit deficient in rhythmogenesis and prone to epileptiform discharges. Our findings demonstrate an essential role for NPTXs in controlling network dynamics highlighting potential therapeutic targets for disorders with inhibition/excitation imbalances such as schizophrenia.


Figures

Figure 1
Figure 1. Developmental profile of hippocampal GluA4 expression
(A) Representative image illustrating the mature immunolabeling pattern of GluA4 in wild type hippocampus (bar, 100 μm). (B Low magnification (10X) and digitally zoomed panels reveal) expression of GFP and GluA4 in representative sections from Nkx2-1-cre:RCE mice at the indicated ages (bars, 100/50 μm for low/high mag. images respectively). (C) Group data summarizing the developmental expression of GluA4/XFP double positive cells as percentages of the XFP+ population (solid line, left axis) and GluA4+ population (dashed line, right axis). Mice/sections counted: 2/6, P2; 3/9, P5; 4/10, P10, P14, P21 and P40.
Figure 2
Figure 2. Loss of GluA4 in NPTX2−/−/NPTXR−/− mice
(A) GluA4 expression in representative sections from P21 WT and NPTX2−/−/NPTXR−/− mice (top panels; 10X, bar 200μm) with zoomed images of CA1 and DG (bottom panels; bar 50μm). (B) Representative images illustrating GluA4 and PV expression in CA1 of P21WT and NPTX2−/−/NPTXR−/− mice (20X, bar 50μm). (C) Summary plots of GluA4+/PV+ double positive cells as percentages of the GluA4+ population (left axis) and the density of GluA4+ cells (right axis) in WT and NPTX2−/−/NPTXR−/− mice. Mice/sections counted: 5/12, WT; 6/14, NPTX2−/−/NPTXR−/−. (D) Representative images of PV (green), GluA4 (red), and DAPI (blue) staining in dissociated hippocampal cultures from wild type and NPTX2−/−/NPTXR−/− mice. Low magnification images (upper, bar 150 μm) show merged fluorescence signals and digitally zoomed panels (lower panels, bar, 40 μm) from boxed dendritic regions above highlight GluA4 and PV signals in isolation. (E) Histogram summarizing the percentage of PV+ cells that express GluA4+ in wild type, NPTX2−/−, NPTXR−/−, and NPTX2−/−/NPTXR−/− mice. A total of 127 PV+ cells from 19 culture dishes of wild type pups from three different litters, 208 PV+ cells from 19 culture dishes of NPTX2−/−/NPTXR−/− mice from 3 different litters, 548 PV+ cells from 12 dishes of NPTX2−/− pups from 3 litters, and 310 PV+ cells from 12 culture dishes from 3 NPTXR−/− litters were examined, with each litter representing a single n. For each litter paired wild type and knockout cultures were produced, processed, and analyzed in parallel. (F) Sample electron micrographs from hippocampal sections of wild type and NPTX2−/−/NPTXR−/− mice illustrating asymmetric synapses (arrowheads) in PV immunopositive processes (15 nm gold, *) probed for GluA4 (5nm gold, arrows in WT) (bars 100 nm). (G) Histogram summarizing the density of GluA4 immunogold label observed at asymmetric synapses onto PV immunopositive dendrites in wild type and NPTX2−/−/NPTXR−/− mice. Insets show the percentage of GluA4 labeled versus unlabeled asymmetric synapses in PV immunopositive processes of wild type (top) and NPTX2−/−/NPTXR−/− (bottom) mice. A total of 152 assymetric synapses from 2 wild type mice and a total of 82 assymetric synapses from 3 NPTX2−/−/NPTXR−/− mice were examined. (H) Representative sample western blots for GluA4, along with β-actin, from hippocampal synaptosomal preparations obtained from wild type, NPTX2−/−, NPTXR−/−, and NPTX2−/−/NPTXR−/− mice. (I) Plotted is a quantitative summary of GluA4 levels in hippocampal synaptosomal preparations from wild type, NPTX2−/−, NPTXR−/−, and NPTX2−/−/NPTXR−/− mice. The amount of GluA4 is expressed relative to β-actin and a total of 18 mice from 14 independent litters for each genotype were paired and analyzed in parallel. (J) At left is a representative sample immunoblot of discrete biochemical fractions from wild type hippocampus probed for GluA4 illustrating preferential partitioning of GluA4 into the SPM fraction (S2= post-nuclear supernatant, P2= pellet 2, S3= supernatant 3, I= input for sucrose gradient, LM, light membranes; MM, microsomal membranes; SPM, synaptic plasma membranes; Mito, mitochondria). At right is a representative sample immunoblot of wild type and NPTX2−/−/NPTXR−/− SPMs run in parallel and probed for GluA4 (upper blot) and actin (lower blot) illustrating the loss of GluA4 signal in NPTX2−/−/NPTXR−/− hippocampal synapses (SPM GluA4/actin = 5.8±1.3 and 0.57±0.08 for WT and NPTX2−/−/NPTXR−/− respectively; p=0.02, n=3 mice per genotype). Values plotted throughout are mean±s.e.m.; * p<0.05, Student’s t-test or Mann-Whitney U Test as appropriate. See also Figure S1.
Figure 3
Figure 3. Normal PNN, stargazin, and GluA4 mRNA levels in NPTX2−/−/NPTXR−/− mice
(A) Representative images of PNN staining with WFA in Nkx2-1-cre:RCE hippocampal sections obtained at the developmental time points indicated (bar 100μm). (B) Group data plot illustrating the time course for PNN formation around GFP+ cells in Nkx2-1-cre:RCE mice. Mice/sections counted: 2/6, P2; 3/3, P5; 2/6, P10; 3/5 P14; 2/6 P21; and 3/5 P40. (C,D) Representative images (C) and group data (D) illustrating the co-localization of PNNs and PV+ cells in hippocampal sections obtained from P21-30 wild type and NPTX2−/−/NPTXR−/− mice (bar 35μm). Mice/sections counted: 5/5, WT; 2/5, NPTX2−/−/NPTXR−/−. (E) Representative immunoblots illustrating that pull-down of GluA4 from hippocampal synaptic plasma membranes co-precipitates stargazin (γ2) as well as GluA4 itself (IP lanes). Also shown are the input (IN) and flow through (FT) materials probed with the same antibodies (comparing FT/IN signals revealed that 55±9% of available SPM stargazin co-precipitated with GluA4, n=4 mice). (F) Representative western blots of the indicated cell fractions from wild type and NPTX2−/−/NPTXR−/− hippocampi probed with an antibody that recognizes stargazin (γ2) and TARPγ8 (γ8; upper blot) or GluA4 (lower blot). SPM stargazin/actin = 0.38±0.06 and 0.34±0.06 for wild type and NPTX2−/−/NPTXR−/− mice respectively, p=0.66, n=3 mice per genotype. (G) Representative images of PV+ cells from wild type and NPTX2−/−/NPTXR−/− mice cultures confirming stargazin/γ8 expression in PV+ cells in both genotypes (scale bar 50 μm). (H) Representative single trial qPCR amplification plots for GluA4 mRNA (solid black), PV (grey), and GADPH (hashed black) from wild type and NPTX2−/−/NPTXR−/− hippocampi. Relative fluorescence intensities (deltaRn) are plotted against PCR cycle numbers on a logarithmic scale. (I) Group data summarizing the abundance of GluA4 mRNA (relative to GADPH) in hippocampi from wild type and NPTX2−/−/NPTXR−/− mice. 3 independent experiments using RNA from 3 independent litters of each genotype were performed. (J,K) Representative sample images (J) and group data summary (K) of wild type and NPTX2−/−/NPTXR−/− hippocampal sections probed for PV and GluA4 mRNA by fluorescent in situ hybridization (bar 50μm). Cells/sections/mice counted: 165/4/2, WT; 196/6/3, NPTX2−/−/NPTXR−/−. See also Figure S1.
Figure 4
Figure 4. Impaired PVFSI AMPAR function and feedforward inhibition in NPTX2−/−/NPTXR−/− mice
(A) Representative PVFSIs recorded in wild type and NPTX2−/−/NPTXR−/− mice with corresponding AMPA and NMDA EPSC traces evoked by granule cell stimulation (bars, 100μm). (B) Summary for AMPA/NMDA ratios in PVFSIs at granule cell (MF, n=16cells/8mice, 4cells/4mice, 8cells/5mice, 15cells/7mice for WT, NPTX2−/−, NPTXR−/−, NPTX2−/−/NPTXR−/− respectively; *p=0.00007 vs. WT, Mann-Whitney U test) and medial perforant path (PP, n=15 cells/6mice, 6 cells/3mice, 7cells/3mice for WT, NPTXR−/− and NPTX2−/−/NPTXR−/− respectively; *p=0.02 vs. WT Mann-Whitney U test) inputs for indicated genotypes (PP inputs not determined (ND) for NPTX2−/− mice). Also plotted are PPRs (5Hz) of MF-PVFSI EPSCs. Inset, I–V relation for AMPAR-mediated transmission, and sample traces, at PP inputs to NPTX2−/−/NPTXR−/− PVFSIs (n=5cells/3mice). (C) Representative sEPSC recordings (left) and ensemble average sEPSC (right) recorded in WT and NPTX2−/−/NPTXR−/− PVFSIs. (D) Summary of PVFSI sEPSC properties for the indicated genotypes (n=39cells/16mice, 23cells/8mice, 14cells/7mice, 20cells/9mice for WT, NPTX2−/−, NPTXR−/−, NPTX2−/−/NPTXR−/− respectively; *p=0.002, 0.03, 0.01, and 0.01 for Amplitude, Taudecay, Frequency and Frequency, respectively vs. WT) and cumulative probability plots comparing WT and NPTX2−/−/NPTXR−/− PVFSIs (insets). (E) Schematic (above, left) and sample traces (below, left) illustrating methodology for recording SC-CA1 feedforward inhibition, along with representative sample recordings in wild type and NPTX2−/−/NPTXR−/− mice (right). (F) Group data summary plot of I/E ratios observed using train stimulation in wild type and NPTX2−/−/NPTXR−/− mice (n=10cells/3mice and 9cells/3mice for wild type and NPTX2−/−/NPTXR−/− respectively; p=0.04, 0.005, 0.02, 0.008 for P1,P3,P4,P5 respectively, Mann-Whitney U test). Inset shows SC-CA1 excitatory field potential recording (fEPSP) input-output relations, with traces from representative recordings, for wild type and NPTX2−/−/NPTXR−/− mice. (G) Image of a representative NPTX2−/−/NPTXR−/− dentate PVFSI (bar, 100μm) and associated voltage responses (lower inset) to hyperpolarizing current injection (-200pA) as well as depolarizing current injections peri-threshold (250pA) and twice peri-threshold (500pA) for action potential firing (inset bars, 250ms/20mV). (H) Histogram summarizing resting membrane potentials (Vrest), input resistances (Rin), action potential thresholds (Vthresh), firing frequencies at twice threshold current injection (f @2Xthresh), and maximal firing frequencies (fmax) measured in wild type (n=16 cells/7 mice) and NPTX2−/−/NPTXR−/− (n=9 cells/4 mice) PVFSIs. (I) Continuous traces (upper) from representative CA1 PC recordings in wild type (left) and NPTX2−/−/NPTXR−/− (right) mice illustrating the effects of oxytocin receptor agonist ((Thre4, Gly7)-oxytocin, TGOT) treatment to evoke release from PVFSIs on sIPSCs. Traces below show the indicated regions on an expanded time scale. (J) Summary time course plot of the effects of TGOT on sIPSC amplitudes in wild type (n=6 cells from 3 mice) and NPTX2−/−/NPTXR−/− (n=7 cells from 3 mice) CA1 PCs. sIPSC amplitudes measured during 30s epochs during TGOT treatment were normalized to the average amplitude measured prior to TGOT application. Also plotted is the effect of TGOT in wild type CA1 PCs treated with Omega-Agatoxin (AgTX, 500 nM; n = 4 cells from 2 mice) to prevent release from PVFSIs confirming that TGOT selectively drives sIPSC output from PVFSIs (Hefft and Jonas, 2005; Owen et al., 2013). Values plotted throughout are average±s.e.m. Recordings throughout were made in slices from mice aged P15-P30. See also Figure S2.
Figure 5
Figure 5. Prolonged critical period for GDP expression in NPTX2−/−/NPTXR−/− mice
(A,B) Representative sample traces illustrating GDPs recorded in slices from wild type (A) and NPTX2−/−/NPTXR−/− mice with individual GDPs illustrated below on an expanded time scale. (C–F) Histograms summarizing the developmental profiles (ages indicated along x-axis) for the percentage of CA3 PCs exhibiting GDPs (C), GDP frequency averaged across recorded cells for each stage of development (D), GDP half widths observed across development (E) and the average total charge transferred through GDPs at each stage of development (F) in wild type and NPTX2−/−/NPTXR−/− slices. For wild type recordings the total number of cells and mice recorded at each time point (P6-7 to P13) were: 15/3;7/2;12/2;10/2;12/2;11/3;6/1. For NPTX2−/−/NPTXR−/−mice: 19/3;18/3;14/2;24/3;13/2;14/2;8/1. * in D p=0.015, Mann-Whitney U test. Note, as GDPs were not observed at P12 and 13 in wild type mice we did not perform any statistical comparisons with GDP properties of NPTX2−/−/NPTXR−/− mice at these stages. (G–H) Summary plots illustrating the effects of cannabinoid receptor antagonism with WIN 55,212-2 mesylate (WIN, 5μM) and NMDAR antagonism with DL-APV (APV, 100μM) on GDP frequencies in wild type and NPTX2−/−/NPTXR−/− mice. Plotted are GDP frequencies observed in each recording before (Ctl) and after WIN or APV treatment. In G **, p=0.007 and 9.7×10⁻⁴ for WT and NPTX2−/−/NPTXR−/− respectively (Wilcoxon test). In H *, p=0.026 and 0.015 for wild type and NPTX2−/−/NPTXR−/− respectively (paired t-test).
Figure 6
Figure 6. Impaired gamma oscillations in NPTX2−/−/NPTXR−/− mice both in vitro and in vivo
(A,B) In vitro gamma oscillations detected in field recordings (top and middle) from CA3 in slices from wild type (A) or NPTX2−/−/NPTXR−/− (B) mice after bath application of 25μM carbachol (CCh), with corresponding Wavelet transform (bottom). (C) Power density spectra from representative recordings of CCh-evoked gamma oscillations in wild type (black), NPTX2−/− (red), NPTXR−/− (blue) and NPTX2−/−/NPTXR−/− (green) mice. Inset shows corresponding sample traces. (D) NPTX2−/−/NPTXR−/− mice had significant gamma oscillation deficits (Log10 peak gamma power, WT (n=21) vs NPTX2−/− (n=8) vs NPTXR−/− (n=15) vs NPTX2−/−/NPTXR−/− (n=24); −2.89 ± 0.11 vs −3.17 ± 0.14 vs −2.92 ± 0.16 vs −3.43 ± 0.12; p=0.0074, one-way ANOVA with post hoc Bonferroni multiple comparisons); inset shows cumulative frequency distributions of the peak gamma power for WT and NPTX2−/−/NPTXR−/− mice. (E) No significant differences in peak gamma frequency were observed (WT vs NPTX2−/− vs NPTXR−/− vs NPTX2−/−/NPTXR−/−: 33.7 ± 0.75 Hz vs 34.1 ± 1.00 Hz vs 31.7 ± 1.23 Hz vs 33.5 ± 1.07 Hz; F=0.898, p=0.447, one-way ANOVA). (F) NPTXR−/− and NPTX2−/−/NPTXR−/− mice displayed significantly greater variability in gamma frequency (deviation from mean frequency, WT vs NPTX2−/− vs NPTXR−/− vs NPTX2−/−/NPTXR−/−: 1.80 ± 0.43 Hz vs 2.34 ± 0.47 Hz vs 4.04 ± 0.59 Hz vs 4.51 ± 0.65 Hz; H=16.64, p=0.0008, Kruskal-Wallis test with post hoc Dunn’s multiple comparisons test). (G, H) Representative in vivo recordings from CA1 stratum pyramidale of wild type (G) or NPTX2−/−/NPTXR−/− (H) mice, showing raw traces (top), the same traces band-pass filtered between 25 and 90Hz to show the gamma band (middle) and band-pass filtered between 5 and 10Hz to show the theta band (bottom). Traces at right with expanded time scale are from boxed regions of the longer time compressed traces. (I) Normalized power spectra, averaged from all mice in wild type (black, n=6) or NPTX2−/−/NPTXR−/− (green n=6) groups. (J) NPTX2−/−/NPTXR−/− mice displayed a significant reduction in peak gamma power (z-score, WT vs NPTX2−/−/NPTXR−/− : 2.13 ± 0.27 vs 1.34 ± 0.20; t=2.410; p=0.0367; Student’s t test) and (K) peak gamma frequency WT vs NPTX2−/−/NPTXR−/− : 38.0 ± 0.86 vs 33.2 ± 1.03; t=3.608; p=0.0048; Student’s t test). (L) NPTX2−/−/NPTXR−/− mice did not display significant differences in peak theta power (z-score, WT vs NPTX2−/−/NPTXR−/− : 4.38 ± 1.01 vs 5.37 ± 0.71; t=0.7938; p=0.4457, Student’s t test) but (M) did display a small but significant decrease in peak theta frequency (WT vs NPTX2−/−/NPTXR−/− : 7.50 ± 0.18 vs 6.75 ± 0.28; t=2.236; p=0.0493; Student’s t test). *, p <0.05 **, p < 0.01; ***, p < 0.001 vs wild type. In vitro recordings were performed in slices from mice aged P15-21 and in vivo recordings were performed in P32-34 mice.
Figure 7
Figure 7. Altered SWRs and behavioral deficits in NPTX2−/−/NPTXR−/− mice
(A,B) Depth profiles (inter-electrode distance of 50μm) of representative recordings illustrating SWRs in (A) wild type and (B) NPTX2−/−/NPTXR−/− mice in vivo. (C) The incidence of SWRs was significantly reduced in NPTX2−/−/NPTXR−/− mice (WT (n=6) vs NPTX2−/−/NPTXR−/− (n=6): 0.26 ± 0.05 Hz vs 0.13 ± 0.02 Hz; p=0.0387; Student’s t test). (D,E) Examples of sharp wave ripples from (D) wild type and (E) NPTX2−/−/NPTXR−/− mice, recorded from stratum pyramidale, bandpass filtered (130 to 250Hz, top) with corresponding wavelet transforms of the raw traces (bottom). (F) NPTX2−/−/NPTXR−/− mice did not display a significant difference in the SWR duration (WT vs NPTX2−/−/NPTXR−/− : 59.7 ± 2.96 ms vs 58.8 ± 5.5 ms; p=0.8880; Student’s t test). (G) NPTX2−/−/NPTXR−/− mice did show a significant reduction in the peak frequency of SWRs (WT vs NPTX2−/−/NPTXR−/− : 157 ± 2.47 Hz vs 142 ± 3.05 Hz; p=0.0037; Student’s t test). NPTX2−/−/NPTXR−/− mice did not display a significant difference in either (H) SWR amplitude (WT vs NPTX2−/−/NPTXR−/− : 348 ± 48.2 μV vs 326 ± 36.6 μV; t=0.3622; p=0.7247; Student’s t test) or (I) SWR power (peak power, mV2/Hz, WT vs NPTX2−/−/NPTXR−/− : 0.31 ± 0.04 vs 0.28 ± 0.03; t=0.4777; p=0.6431; Student’s t test). (J) NPTX2−/−/NPTXR−/− showed early open field locomotor hyperactivity and late hypoactivity (n=15 WT and 13 NPTX2−/−/NPTXR−/− mice; genotype x time interaction: F1,26=7.8620, p=0.0094; 2-way ANOVA). (K-L) NPTX2−/−/NPTXR−/− displayed increased anxiety-like behavior in (K) the novel open field (t=2.3810, p=0.0248; Student’s t test). (L) Anxiety-like behavior was confirmed in the elevated O-maze (n=15 mice per genotype; t=2.1624, p=0.0393; Student’s t test). (M) NPTX2−/−/NPTXR−/− mice made fewer correct choices in a reward alternation task (n=7 WTs and 11 mutants; main effect of genotype; F1,16=7.7876, p=0.0131; 2-way ANOVA) *, p <0.05 **, p < 0.01, ***, p < 0.001 vs wild type. In vivo recordings were performed in P32-34 mice and behavior was assessed in P70-91 mice.
Figure 8
Figure 8. Increased susceptibility to epileptiform activity in NPTX2−/−/NPTXR−/− mice
(A) Representative recordings of epileptiform activity induced following bath application of 8.5 mM [K+]o in slices from wild type mice: (i) representative trace from WT mouse showing rhythmic clusters of interictal events; (ii) two clusters of interictal events from boxed region of i on an expanded time scale; (iii) expanded time scale trace from boxed area in ii, showing rhythmicity of interictal events; (iv) single interictal event from boxed area of iii on expanded time scale. (B) Similar to A but for a representative NPTX2−/−/NPTXR−/− recording: (i) representative trace from NPTX2−/−/NPTXR−/− mouse showing rhythmic clusters of ictal events; (ii) single ictal event from boxed region in i on expanded time scale; (iii) boxed event from ii on expanded time scale with interictal events preceding the onset of an ictal event; (iv) beginning of ictal event on an expanded time scale from boxed region in iii. (C) NPTX2−/−/NPTXR−/− mice displayed significantly more ictal events during high K+ epileptiform activity (ictal events per hour, WT (n=9) vs NPTX2−/− (n=7) vs NPTXR−/− (n=7) vs NPTX2−/−/NPTXR−/− (n=11): 0.78 ± 0.39 vs 8.77 ± 6.05 vs 4.60 ± 2.48 vs 19.12 ± 4.64; H=13.85, p=0.0031, Kruskal-Wallis test with post hoc Dunn’s multiple comparisons test). (D) Interictal events in NPTX2−/−/NPTXR−/− mice were significantly less frequent (interictal event frequency, WT vs NPTX2−/− vs NPTXR−/− vs NPTX2−/−/NPTXR−/−: 0.70 ± 0.07 Hz vs 0.73 ± 0.15 Hz vs 0.35 ± 0.10 Hz vs 0.41 ± 0.04 Hz; p=0.0033, Kruskal-Wallis test with post hoc Dunn’s multiple comparisons test). (E) Representative recording from an NPTX2−/−/NPTXR−/− slice showing the effect of indiplon on high K+ induced ictal activity. Shown is a full time course of indiplon-mediated attenuation of ictal events (i) with a single ictal event prior to indiplon application (ii) and remaining interictal events (iii) after indiplon from the boxed regions in i shown on expanded time scales. (F) Bath application of indiplon significantly reduced the frequency of ictal events in NPTX2−/−/NPTXR−/− mice (ictal events per hour, baseline vs indiplon (n=6): 30.0 ± 4.3 vs 10.3 ± 5.9; p = 0.0141; Paired t test. **, p < 0.01 vs WT). Recordings throughout were performed in P15-30 mice.

References

    1. Barad Z, Shevtsova O, Arbuthnott GW, Leitch B. Selective loss of AMPA receptors at corticothalamic synapses in the epileptic stargazer mouse. Neuroscience. 2012;217:19–31. - PubMed
    1. Bartos M, Vida I, Jonas P. Synaptic mechanisms of synchronized gamma oscillations in inhibitory interneuron networks. Nat Rev Neurosci. 2007;8:45–56. - PubMed
    1. Belforte JE, Zsiros V, Sklar ER, Jiang Z, Yu G, Li Y, Quinlan EM, Nakazawa K. Postnatal NMDA receptor ablation in corticolimbic interneurons confers schizophrenia-like phenotypes. Nat Neurosci. 2010;13:76–83. - PMC - PubMed
    1. Ben-Ari Y, Cherubini E, Corradetti R, Gaiarsa JL. Giant synaptic potentials in immature rat CA3 hippocampal neurones. J Physiol. 1989;416:303–325. - PMC - PubMed
    1. Ben-Ari Y, Gaiarsa JL, Tyzio R, Khazipov R. GABA: a pioneer transmitter that excites immature neurons and generates primitive oscillations. Physiol Rev. 2007;87:1215–1284. - PubMed

Publication types

LinkOut - more resources