

Effects of primary care team social networks on quality of care and costs for patients with cardiovascular disease
- PMID: 25755035
- PMCID: PMC4369607
- DOI: 10.1370/afm.1754
Effects of primary care team social networks on quality of care and costs for patients with cardiovascular disease
Abstract
Purpose: Cardiovascular disease is the leading cause of mortality and morbidity in the United States. Primary care teams can be best suited to improve quality of care and lower costs for patients with cardiovascular disease. This study evaluates the associations between primary care team communication, interaction, and coordination (ie, social networks); quality of care; and costs for patients with cardiovascular disease.
Methods: Using a sociometric survey, 155 health professionals from 31 teams at 6 primary care clinics identified with whom they interact daily about patient care. Social network analysis calculated variables of density and centralization representing team interaction structures. Three-level hierarchical modeling evaluated the link between team network density, centralization, and number of patients with a diagnosis of cardiovascular disease for controlled blood pressure and cholesterol, counts of urgent care visits, emergency department visits, hospital days, and medical care costs in the previous 12 months.
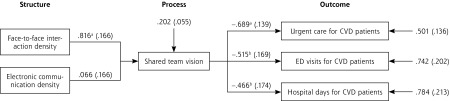
Results: Teams with dense interactions among all team members were associated with fewer hospital days (rate ratio [RR] = 0.62; 95% CI, 0.50-0.77) and lower medical care costs (-$556; 95% CI, -$781 to -$331) for patients with cardiovascular disease. Conversely, teams with interactions revolving around a few central individuals were associated with increased hospital days (RR = 1.45; 95% CI, 1.09-1.94) and greater costs ($506; 95% CI, $202-$810). Team-shared vision about goals and expectations mediated the relationship between social network structures and patient quality of care outcomes.
Conclusions: Primary care teams that are more interconnected and less centralized and that have a shared team vision are better positioned to deliver high-quality cardiovascular disease care at a lower cost.
Keywords: cardiovascular diseases; electronic health records; emergency departments; face-to-face communication; hospital days; patient care team; patient outcome assessment; primary health care; social networks; team vision.
© 2015 Annals of Family Medicine, Inc.
Figures


References
-
- Smith M. Best Care at Lower Cost: The Path to Continuously Learning Health Care in America. Washington, DC: Institute of Medicine; 2013. - PubMed
-
- Smith M, Halvorson G, Kaplan G. What’s needed is a health care system that learns: recommendations from an IOM report. JAMA. 2012;308(16):1637–1638. - PubMed
Publication types
MeSH terms
Substances
Grants and funding
LinkOut - more resources
Full Text Sources
Other Literature Sources