. 2015 May 18;16(7):1387-94.
doi: 10.1002/cphc.201402794. Epub 2015 Mar 5.

Spectral imaging to measure heterogeneity in membrane lipid packing

Affiliations

Spectral imaging to measure heterogeneity in membrane lipid packing

Erdinc Sezgin et al. Chemphyschem. .

Abstract

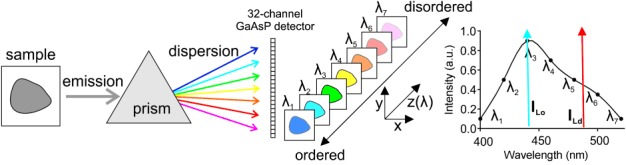
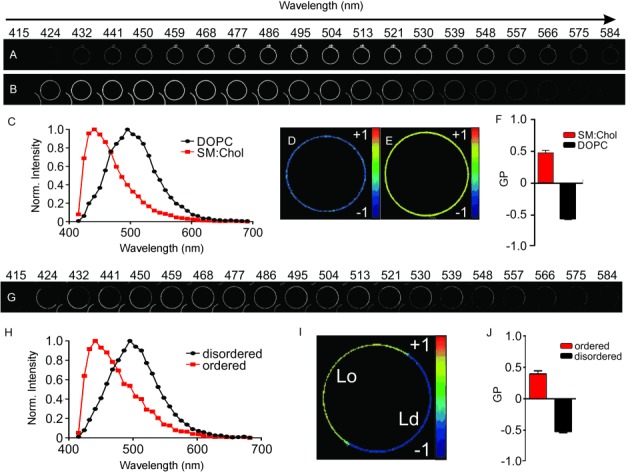
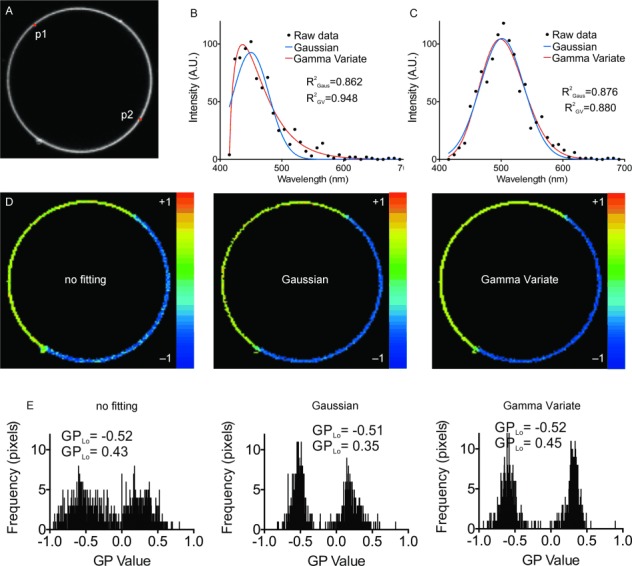
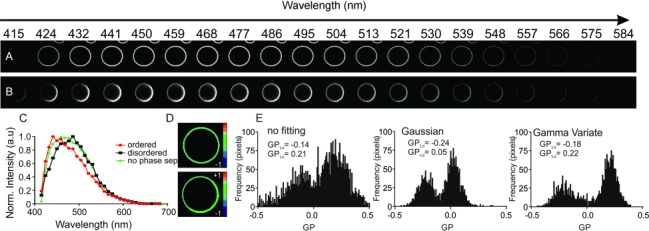
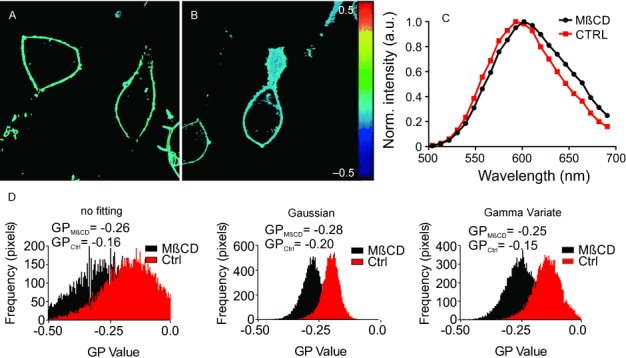
Physicochemical properties of the plasma membrane have been shown to play an important role in cellular functionality. Among those properties, the molecular order of the lipids, or the lipid packing, is of high importance. Changes in lipid packing are believed to compartmentalize cellular signaling by initiating coalescence and conformational changes of proteins. A common way to infer membrane lipid packing is by using membrane-embedded polarity-sensitive dyes, whose emission spectrum is dependent on the molecular order of the immediate membrane environment. Here, we report on an improved determination of such spectral shifts in the emission spectrum of the polarity-sensitive dyes. This improvement is based on the use of spectral imaging on a scanning confocal fluorescence microscope in combination with an improved analysis, which considers the whole emission spectrum instead of just single wavelength ranges. Using this approach and the polarity-sensitive dyes C-Laurdan or Di-4-ANEPPDHQ, we were able to image-with high accuracy-minute differences in the lipid packing of model and cellular membranes.

Keywords: C-laurdan; generalized polarization; lipid packing; membrane rafts; spectral imaging.


Figures

Figure 1
Figure 1
Spectral GP imaging: Fluorescence emission from the sample is generated by illumination with laser light. The collected fluorescence light is dispersed (using a prism or other device) and guided onto several parallel detectors, such as a sensitive 32-channel GaAsP detector. Each channel of the detector records a signal at different wavelengths at (in our case) approximately 8.9 nm wavelength intervals. This signal is then used to generate the emission spectrum of the fluorophore for each image pixel (only 7 of the 32 channels are shown), giving precise values of the intensities IB and IR (blue and red arrows).
Figure 2
Figure 2
Spectral GP imaging of GUVs. A–F) Representative single-phase vesicles. A,B) Simultaneously recorded 30 μm x 30 μm large fluorescence images for 20 different 8.9 nm-wide spectral wavelength windows between 415 and 584 nm of the equatorial plane of representative DOPC (A) and SM:Chol (B) GUVs labeled with the environment-sensitive dye C-Laurdan. Notice the red-shift in fluorescence for the more disordered DOPC GUVs. C) Representative fluorescence emission spectra of C-Laurdan in a single pixel of the recorded image stacks for the DOPC (black) and SM:Chol (red) GUVs. D,E) Final GP image (size 30 μm x 30 μm) of the DOPC (D) and SM:Chol (E) GUVs. F) Average and standard deviation of the GP values determined from the GP images recorded for at least 5 GUVs. G–J) Representative phase-separated vesicles. G) Simultaneously recorded 30 μm x 30 μm large fluorescence images (as in A,B) of the equatorial plane of representative phase-separated DOPC:SM:Chol (2:2:1) GUVs labeled with the environment-sensitive dye C-Laurdan. Notice the shift in fluorescence for the different parts of the GUVs. H) Representative fluorescence emission spectra of C-Laurdan in a single pixel of the recorded image stacks for the disordered (black, more red-shifted fluorescence) and ordered (red) phases. I) Final GP image (size 30 μm x 30 μm) of the GUV. J) Average and standard deviation of the GP values determined from the pixels of the disordered and ordered regions of the images recorded for at least five GUVs.
Figure 3
Figure 3
Increasing the accuracy of spectral GP imaging using curve fitting. A) Fluorescence intensity Z-projection image (i.e. addition over the whole spectral image stack, 30 μm x 30 μm) of a representative C-Laurdan-labeled phase-separated GUV (DOPC:SM:Chol, 2:2:1). B,C) Exemplary fluorescence emission spectra taken at pixels p1 (B, Lo phase) and p2 (C, Ld phase) marked in image A with raw data (black dots), Gaussian fit (blue line), and Gamma Variate fit (red line) (fit quality values of the coefficient of determination R2 as labeled). Note that the spectrum of the Lo phase is better described by a Gamma Variate fit. D) GP image of the GUV of panel A following analysis using direct sampling (non-fitting, left), Gaussian fitting (middle) and Gamma Variate fitting (right). All the analysis methods reveal a phase separation; however, the GP image following fitting is less noisy. E) Histograms of all GP values extracted from the images of panel D as labeled, showing that the GP histograms from the curve fitting (especially the Gamma Variate) are more discrete.
Figure 4
Figure 4
Spectral GP imaging of cell-derived GPMVs. A,B) Simultaneously recorded 10 μm x 10 μm large fluorescence images for 20 different 8.9 nm-wide spectral wavelength windows between 415 and 584 nm of the equatorial plane of representative non-phase-separated (A) and phase-separated (B) GPMVs derived from live RBL cells and labeled with C-Laurdan. The differences in emission maxima are barely visible for the two phases. C) Representative fluorescence emission spectra of C-Laurdan in a single pixel of the recorded image stacks for the non-phase separated GPMVs (green), and the disordered (black, more red-shifted fluorescence) and ordered (red) phases of the phase-separated GPMVs. D) Final GP images (size 10 μm x 10 μm) of the non-phase-separated (top) and phase-separated (bottom) GPMVs. E) Histograms of GP values following direct sampling (non-fitting, left), Gaussian fitting (middle) and Gamma Variate fitting (right) indicating the accuracy with which minute changes in lipid packing can be observed using spectral imaging in combination with curve fitting.
Figure 5
Figure 5
Spectral GP imaging of live RBL cells. A,B) GP images (40 μm x 40 μm) of the equatorial plane of live RBL cells using the environment-sensitive membrane dye Di-4-ANEPPDHQ, without (A) and with (B) MβCD treatment. C) Representative fluorescence emission spectra of Di-4-ANEPPDHQ at a single pixel of the recorded image stacks for the untreated (red) and MβCD-treated cells (black). D) Histograms of GP values following the different analysis routines (as labeled) for the untreated (ctrl, red) and MβCD treated (black) experiments.

References

    1. Schmick M, Bastiaens PIH. Cell. 2014;156:1132–1138. - PubMed
    1. Lingwood D, Simons K. Science. 2010;327:46–50. - PubMed
    1. Simons K, Gerl MJ. Nat. Rev. Mol. Cell Biol. 2010;11:688–699. - PubMed
    1. Parasassi T, Krasnowska EK, Bagatolli L, Gratton E. J. Fluoresc. 1998;8:365–373.
    1. Jin L, Millard AC, Wuskell JP, Clark HA, Loew LM. Biophys. J. 2005;89:L4–L6. - PMC - PubMed

Publication types