. 2015 Jan 15;7(1):39-52.
eCollection 2015.

Potential roles of Centipede Scolopendra extracts as a strategy against EGFR-dependent cancers

Affiliations

Potential roles of Centipede Scolopendra extracts as a strategy against EGFR-dependent cancers

Weina Ma et al. Am J Transl Res. .

Abstract

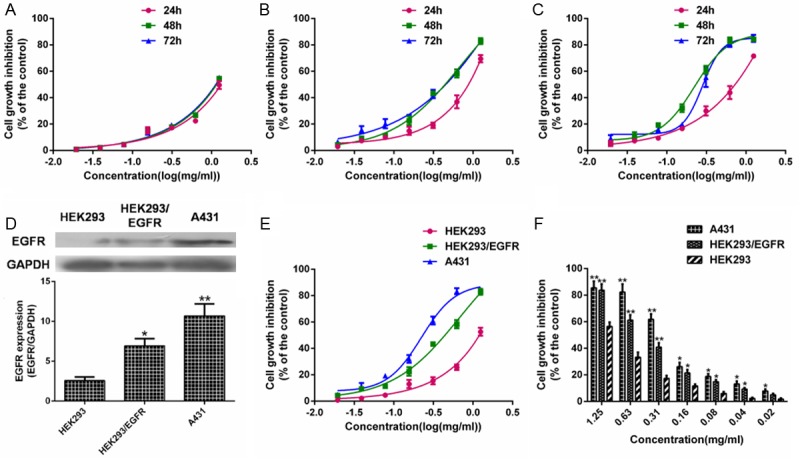
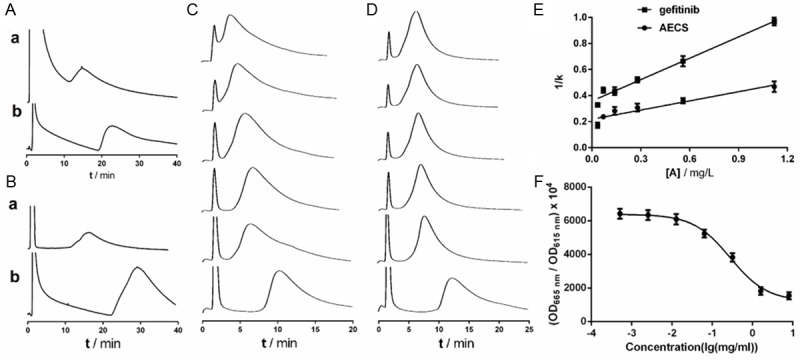
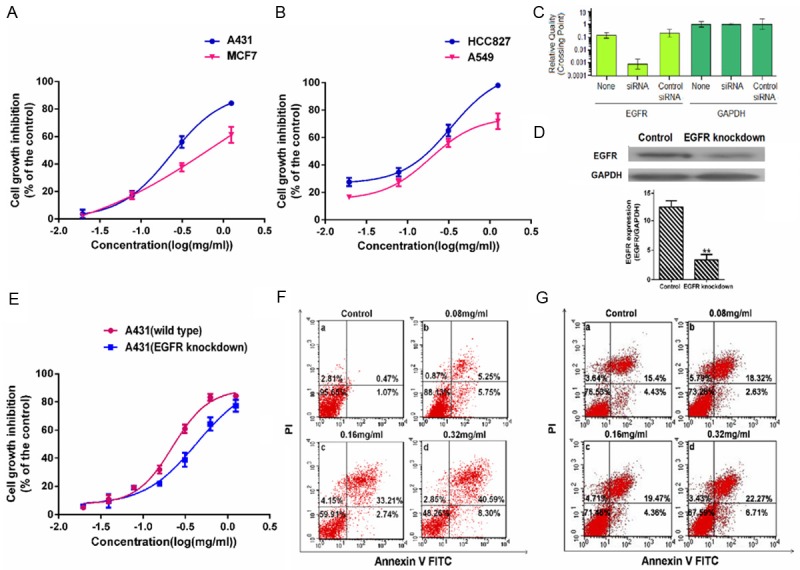
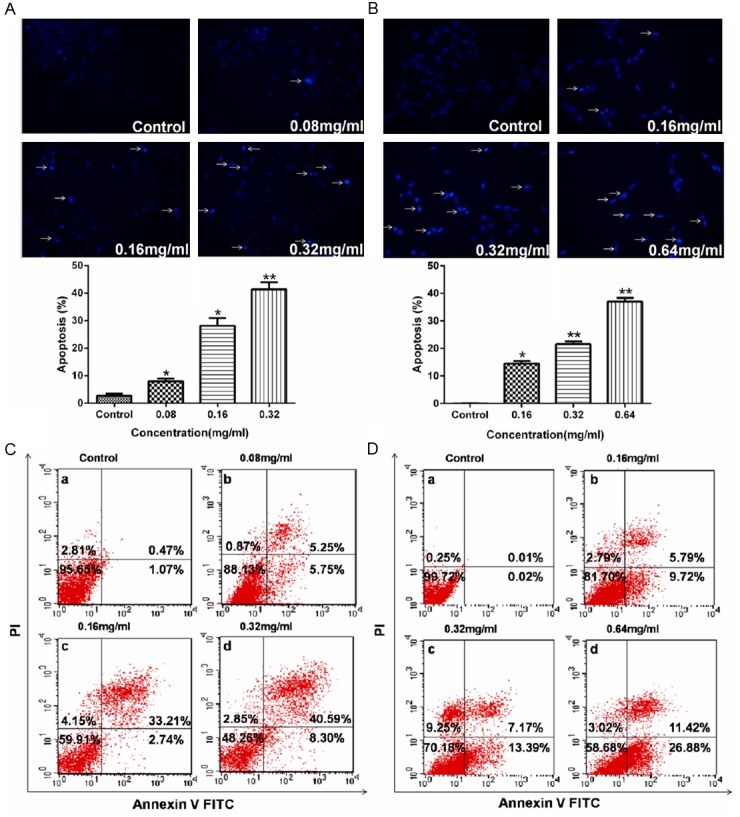
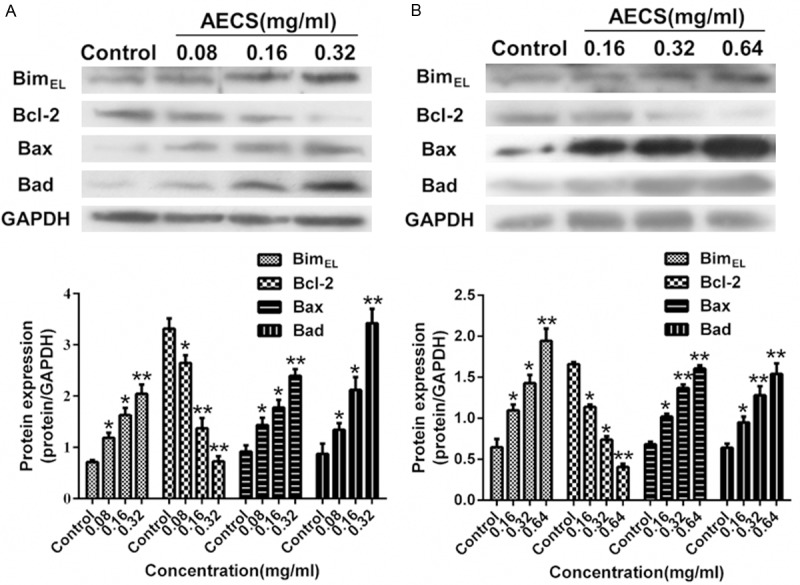
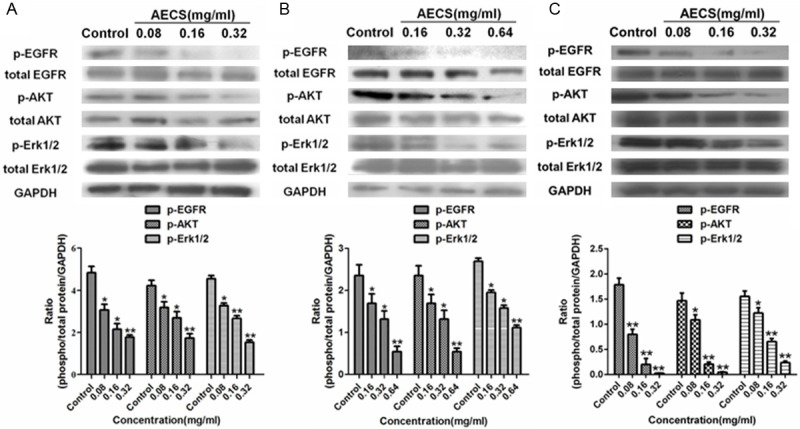
Centipede Scolopendra, a commonly used traditional Chinese medicine, has been shown to have anti-cancer effects. In this study, the inhibitory effect of alcohol extracts of Centipede Scolopendra (AECS) was more prominent when treating cells highly expressing epidermal growth factor receptor (EGFR) (A431 and HEK293/EGFR cells versus HEK293 cells). The elution profiles of AECS on cell membrane chromatography (CMC) column showed that AECS could bind to EGFR, and competition studies indicated that AECS and gefitinib may have direct competition at a single common binding site on EGFR. SiRNA knockdown of EGFR in A431 cells attenuated AECS effects, suggesting that EGFR was a target mediated by AECS. In a cell culture system, AECS dramatically induced apoptosis of A431 and HEK293/EGFR cells, which was associated with the effects on Bcl-2 family. Furthermore, AECS could alter EGFR kinase activity and reduce phosphorylation of EGFR and downstream signaling players AKT and Erk1/2. The mechanism of AECS to inhibit high-EGFR expression cell proliferation is due to its ability to induce apoptosis and modulate the EGFR pathway. This study might provide a novel therapy for cancer with high-EGFR expression.

Keywords: Centipede Scolopendra; apoptosis; cell growth; epidermal growth factor receptor.


Figures

Figure 1
Figure 1
Effect of AECS on the cell growth of high-EGFR expression cells. Cells were treated with AECS at indicated concentration for 24, 48 and 72 h. Cell growth was measured by MTT. The values represent the average of three independent experiments. Data represents the means ± SEM from three repeated experiments. (A) HEK293 cells. (B) HEK293/EGFR cells. (C) A431 cells. (D) Expression levels of EGFR in HEK293, HEK293/EGFR and A431 cells without any treatment were examined by western blot assay, and the results were quantified by densitometry analysis of the bands and normalization to GAPDH. The values represent the average of three independent experiments. Data represents the means ± SEM (n=3). *p < 0.05, **p < 0.01 versus the EGFR expression in HEK293 cell. The samples derive from the same experiment and that blots were processed in parallel. Cells were treated with different concentrations of AECS. Cell growth was measured after 48 h by MTT (E) and trypan blue staining assay (F). Five wells were treated in each experiment. The values represent the average of three independent experiments. Values represent means ± SEM (n=3). *p < 0.05, **p < 0.01 versus the cell growth inhibition in HEK293 cells.
Figure 2
Figure 2
Effect of drugs on the EGFR. The CMC chromatograms of AECS (a) and gefitinib (b) on the HEK293/EGFR CMC column (A) and A431 CMC column (B). Elution profiles of gefitinib on the HEK293/EGFR CMC column with different concentrations of ligands (gefitinib (C) and AECS (D)) in the mobile phase and regression curves achieved by plotting 1/k versus [A] (E). The six concentrations were 0.035, 0.07, 0.14, 0.28, 0.56 and 1.12 mg/L (from bottom to top). Each point with a bar represents the mean ± SEM (n=5). The chromatographic conditions were as follows: CMC column 10 mm×2.0 mm; flow rate 0.2 mL/min; column temperature 37°C; mobile phase 2 mM phosphate-burred saline, pH 7.4. (F) Effect of AECS on the EGFR kinase activity. Initially, 4 μl variable concentrations of AECS (diluted in kinase buffer), 2 μl EGFR kinase, 2 μl substrate and 2 μl ATP were separately added to a 384-well plate and the reaction was allowed to proceed at 37°C for 30 min. The TK-Antibody (5 μl) labeled with Eu3+-cryptate and streptavidin-XL665 (5 μl) was then added with EDTA to the assay plate at room temperature for 1 h. Then the fluorescence was measured using the Perkin-Elmer victor 2030 multilabel plate reader. The results were calculated as follows: ratio=(OD665 nm/OD615 nm)×104. The values represent the average of three independent experiments. Values represent means ± SEM (n=3).
Figure 3
Figure 3
Effects of EGFR in the biological effect induced by AECS. (A) Effect of AECS on cell proliferation in A431 cells and MCF7 cells was determined by MTT assay. (B) Effect of AECS on cell proliferation in HCC827 cells and A549 cells was determined by MTT assay. The values represent the average of three independent experiments. Data represents the means ± SEM from three repeated experiments. Five wells were treated in each experiment. EGFR knockdown affected the AECS’s anti-proliferative and induce-apoptosis activity on A431 cells. EGFR mRNA expression (C) and protein expression (D) in A431 cells transfected with 120 nM EGFR siRNA using Lipofectamine 2000 reagent and EGFR-intact control A431 cells were determined by RT-PCR analysis and western blot assay. Transfection with a control siRNA construct served as a negative control. The values represent the average of three independent experiments. Data represents the means ± SEM (n=3). *p < 0.05, **p < 0.01 versus the EGFR expression in EGFR-intact control A431 cells. The samples derive from the same experiment and that blots were processed in parallel. (E) Effects of AECS on cell proliferation in EGFR-intact control A431 cells and EGFR depleted A431 cells were determined by MTT assay. After treated with EGFR siRNA for 24 hours, cells were treated with AECS for 48 hours. The values represent the average of three independent experiments. Data represents the means ± SEM from three repeated experiments. Five wells were treated in each experiment. The proportion of apoptotic cells was determined by double-staining with Annexin-V/FITC and PI after treatment with different concentrations of AECS in EGFR-intact control A431 cells than (F) and in EGFR depleted A431 cells (G). The flow cytometry profile represents Annexin V-FITC staining in x axis and PI in y axis. The number represents the percentages of cells to each of the four quadrants (viable cells for lower left quadrant, necrotic or dead cells in the higher left quadrant, early apoptotic cells in the lower right quadrant and late apoptotic cells in the higher right quadrant). The values represent the average of three independent experiments. Data represents the means ± SEM (n=3).
Figure 4
Figure 4
AECS induces apoptosis of high-EGFR expression cells. AECS-induced apoptosis in A431 cells (A) and in HEK293/EGFR cells (B), as shown by arrows, were characterized by nuclear condensation or nuclear fragmentation after Hoechst staining (original magnification×200). The proportion of apoptotic cells was determined by double-staining with Annexin-V/FITC and PI after treatment with different concentrations of AECS in A431 cells (C) and in HEK293/EGFR cells (D). The flow cytometry profile represents Annexin V-FITC staining in x axis and PI in y axis. The number represents the percentages of cells to each of the four quadrants (viable cells for lower left quadrant, necrotic or dead cells in the higher left quadrant, early apoptotic cells in the lower right quadrant and late apoptotic cells in the higher right quadrant). The values represent the average of three independent experiments. Data represents the means ± SEM (n=3). *p < 0.05, **p < 0.01 versus the control.
Figure 5
Figure 5
Effects of AECS on BimEL, Bcl-2, Bax and Bad expressions in high-EGFR expression cells. A. Expression levels of BimEL, Bcl-2, Bax and Bad in A431 cells treated with AECS (0, 0.08, 0.16 and 0.32 mg/ml) for 48 h were examined by western blot assay, and the results were quantified by densitometry analysis of the bands and normalization to GAPDH. The values represent the average of three independent experiments. The samples derive from the same experiment and that blots were processed in parallel. B. Expression levels of BimEL, Bcl-2, Bax and Bad in HEK293/EGFR cells treated with and AECS (0, 0.16, 0.32 and 0.64 mg/ml) for 48 h were examined by western blot assay, and the results were quantified by densitometry analysis of the bands and normalization to GAPDH. The values represent the average of three independent experiments. The samples derive from the same experiment and that blots were processed in parallel. Data represents the means ± SEM. *p < 0.05, **p < 0.01 versus the control.
Figure 6
Figure 6
The inhibitory action of AECS on EGFR and its downstream signaling members. A. The phosphorylation of EGFR, AKT and Erk1/2 in cell lysates of A431 cells treated with AECS for 48 h under serum starvation conditions was determined by western blot, and the results were quantified by densitometry analysis. The values represent the average of three independent experiments. The samples derive from the same experiment and that blots were processed in parallel. B. The phosphorylation of EGFR, AKT and Erk1/2 in cell lysates of HEK293/EGFR cells treated with AECS for 48 h under serum starvation conditions was determined by western blot, and the results were quantified by densitometry analysis. The values represent the average of three independent experiments. The samples derive from the same experiment and that blots were processed in parallel. C. The phosphorylation of EGFR, AKT and Erk1/2 in cell lysates of HCC827 cells treated with AECS for 48 h under serum starvation conditions was determined by western blot, and the results were quantified by densitometry analysis. The values represent the average of three independent experiments. The samples derive from the same experiment and that blots were processed in parallel. Data represents the means ± SEM. *p < 0.05, **p < 0.01 versus the control.

References

    1. Moon SS, Cho N, Shin J, Seo Y, Lee CO, Choi SU. Jineol, a Cytotoxic Alkaloid from the Centipede Scolopendra subspinipes. J Nat Prod. 1996;59:777–779. http://www.plosone.org/article/findcited/6597569.
    1. Undheim EAB, King GF. On the venom system of centipedes (Chilopoda), a neglected group of venomous animals. Toxicon. 2011;57:512–524. - PubMed
    1. Gomes A, Datta A, Sarangi B, Kar PK, Lahiri SC. Isolation, purification & pharmacodynamics of a toxin from the venom of the centipede Scolopendra subspinipes dehaani Brandt. Indian J Exp Biol. 1983;21:203–207. http://www.plosone.org/article/findcited/6597569. - PubMed
    1. Liu ZC, Zhang R, Zhao F, Chen ZM, Liu HW, Wang YJ, Jiang P, Zhang Y, Wu Y, Ding JP, Lee WH, Zhang Y. Venomic and Transcriptomic Analysis of Centipede Scolopendra subspinipes dehaani. J Proteome Res. 2012;11:6197–212. - PubMed
    1. Bhagirath T, Chingtham B, Mohen Y. Venom of a hill centipede Scolopendra viridicornis inhibits growth of human breast tumor in mice. Indian J Pharmacol. 2006;38:291–292.

LinkOut - more resources