. 2015 Mar 6;4(1):216-36.
doi: 10.3390/biology4010216.

MALDI Mass Spectrometry Imaging of Lipids and Gene Expression Reveals Differences in Fatty Acid Metabolism between Follicular Compartments in Porcine Ovaries

Affiliations

MALDI Mass Spectrometry Imaging of Lipids and Gene Expression Reveals Differences in Fatty Acid Metabolism between Follicular Compartments in Porcine Ovaries

Svetlana Uzbekova et al. Biology (Basel). .

Abstract

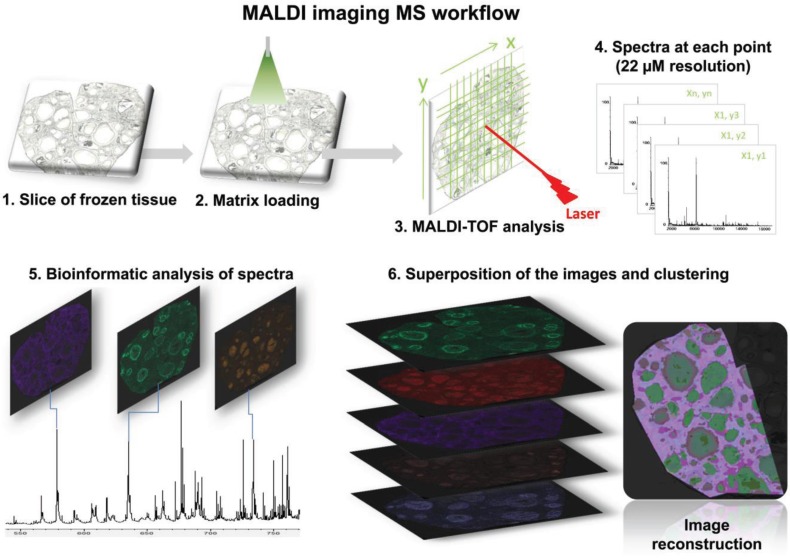
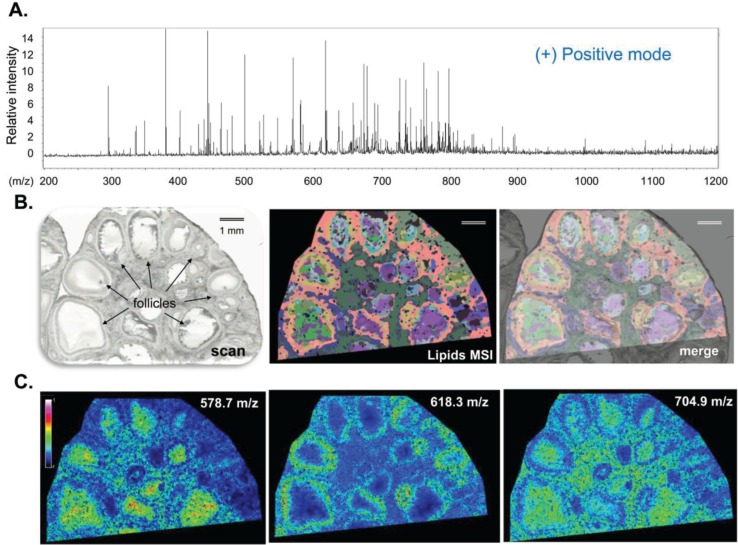
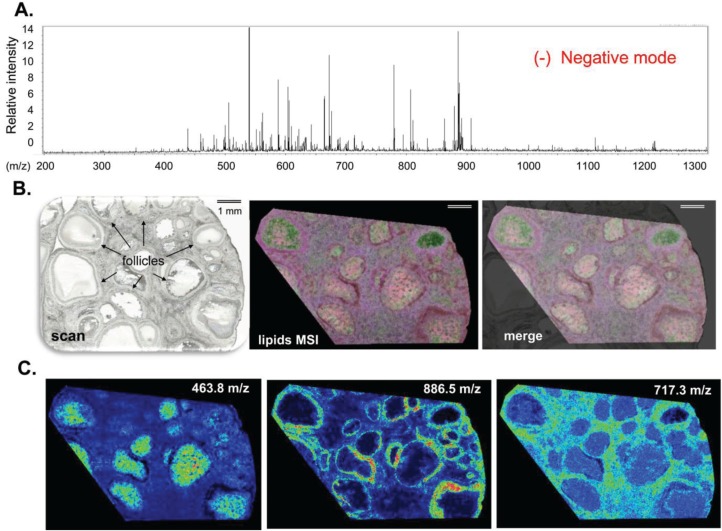
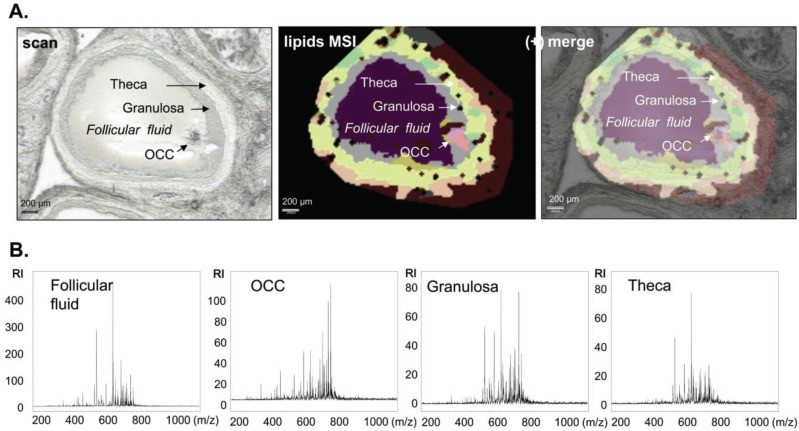
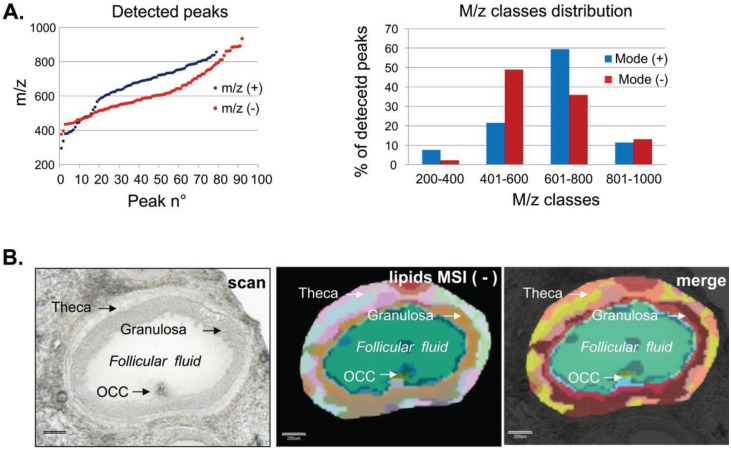
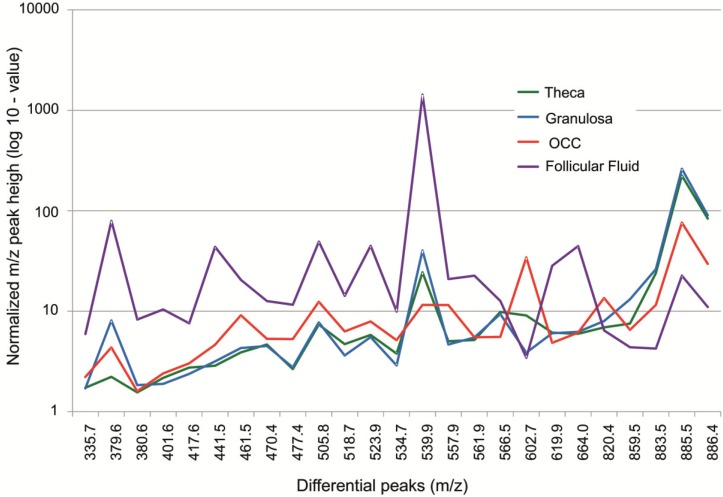
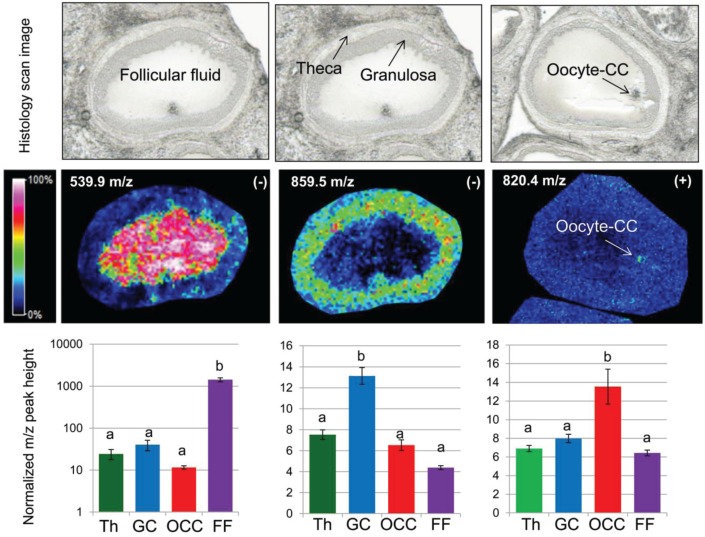
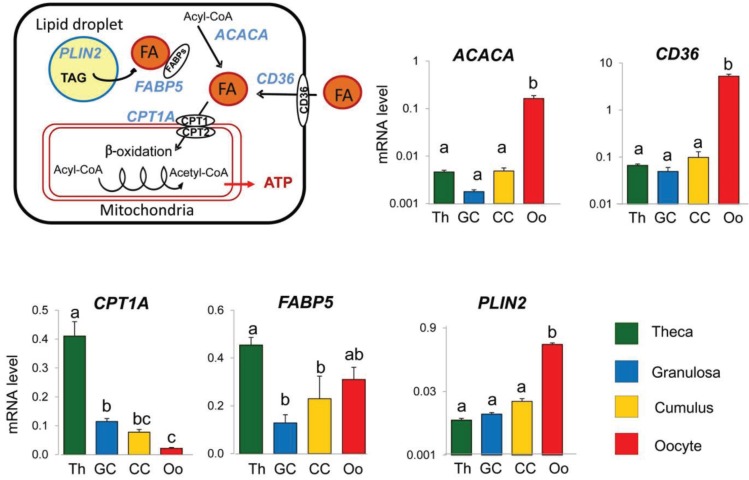
In mammals, oocytes develop inside the ovarian follicles; this process is strongly supported by the surrounding follicular environment consisting of cumulus, granulosa and theca cells, and follicular fluid. In the antral follicle, the final stages of oogenesis require large amounts of energy that is produced by follicular cells from substrates including glucose, amino acids and fatty acids (FAs). Since lipid metabolism plays an important role in acquiring oocyte developmental competence, the aim of this study was to investigate site-specificity of lipid metabolism in ovaries by comparing lipid profiles and expression of FA metabolism-related genes in different ovarian compartments. Using MALDI Mass Spectrometry Imaging, images of porcine ovary sections were reconstructed from lipid ion signals for the first time. Cluster analysis of ion spectra revealed differences in spatial distribution of lipid species among ovarian compartments, notably between the follicles and interstitial tissue. Inside the follicles analysis differentiated follicular fluid, granulosa, theca and the oocyte-cumulus complex. Moreover, by transcript quantification using real time PCR, we showed that expression of five key genes in FA metabolism significantly varied between somatic follicular cells (theca, granulosa and cumulus) and the oocyte. In conclusion, lipid metabolism differs between ovarian and follicular compartments.


Figures

Figure 1
Figure 1
Schematic representation of MALDI Mass Spectrometry Imaging (MSI) of lipids performed on fresh frozen sections of Sus scrofa gilt ovaries. Cryostat ovary section was transferred onto an ITO glass slide (1). The slide was then covered with α-CHCA or DHB (2). After matrix drying, the slide was introduced into the MALDI-TOF mass spectrometer for analysis (3). The laser scans through a set of preselected locations with a spatial resolution set at 50, 35 or 22 µm (4) generated mass spectra of lipids at each point (5). After normalization, ion density maps were created (6) for the ions, which were observed from the representative mass spectra showing the major molecular species (skyline projection spectra). Hierarchical cluster analysis displaying discriminatory signals and creating groups of related molecules based on their classification allowed the reconstruction of a molecular image (7).
Figure 2
Figure 2
High-resolution MALDI MSI in positive reflector ion mode. MALDI MSI analysis of porcine ovary section acquired at 22 µm spatial resolution. (A) Skyline projection spectrum of molecular species (lipids) in the m/z 200–1200 range; (B) Histological image of ovary section (digital scan at 7200 dpi) overlaid (merge) on molecular reconstruction image (Lipids MSI); (C) Molecular images of three lipids showing preferential localization to follicular fluid (m/z 578.7), to follicular wall cells (m/z 618.3) and to interstitial tissue outside follicular cells (m/z 704.9).
Figure 3
Figure 3
High-resolution MALDI MSI in negative reflector ion mode. MALDI MSI analysis of porcine ovary section acquired at 22 µm spatial resolution. (A) Skyline projection spectrum of molecular species (lipids) in the m/z 200–1200 range; (B) Histological image of ovary section (digital scan at 7200 dpi) overlaid (merge) on molecular reconstruction image (Lipids MSI); (C) Molecular images of three lipids showing preferential localization to follicular fluid (m/z 463.8), to follicular wall cells (m/z 886.5) and to interstitial tissue, mainly outside follicular fluid (m/z 704.9).
Figure 4
Figure 4
Assessing spatial lipid distribution of the whole follicle from targeted MALDI MSI analysis performed in positive ion mode. (A) Histological image of follicle describing the follicular compartments (scan) and its superposition (merge) with molecular reconstruction image (lipids MSI). Scale bars = 200 µm; (B) Representative MALDI-TOF MS single spectra acquired directly from the region of interest (Follicular fluid, oocyte-cumulus complex, granulosa and theca) of porcine ovary section in the m/z 200–1000 range. RI = relative intensity.
Figure 5
Figure 5
(A) Comparative distribution of molecular weight (m/z) of the differential lipid species (ANOVA, p < 0.001) detected in positive (blue) and negative (red) reflector ion mode (left panel) and m/z class distributions (right panel). (B) Histological image of the follicle describing the follicular compartments (scan), molecular reconstruction image (lipids MSI) and their superposition (merge). Scale bars = 200 µm.
Figure 6
Figure 6
Comparative analysis of the 25 lipid species that differed most among follicular compartments detected by MALDI MSI in positive and negative ion mode. Log-values of normalized peak heights of the ions detected in follicular fluid, theca, granulosa and oocyte-cumulus complex (OCC) of individual follicles are shown.
Figure 7
Figure 7
Single ion intensity maps and quantification of three lipid species measured at m/z 539.9, m/z 859.5 (in negative ion mode) and at m/z 820.4 (in positive ion mode), which showed their greater abundance in different follicular compartments—follicular fluid (FF), granulosa cells (GC) and oocyte-cumulus complex (OCC)—of individual follicles. Histograms present the mean values ± standard errors (SEM) of the ion intensities (normalized peak height) measured at 12 positions throughout theca, GC, OCC and FF compartments.
Figure 8
Figure 8
Gene expression analysis of lipid metabolism-related genes ACACA, CD36, CPTA1, FABP5 and PLIN2 in porcine follicular compartments (Th, GC, CC and oocyte) by real time qPCR. Histograms present mRNA expression values ± SEM of 8–12 independent samples per compartment.

References

    1. Fair T. Follicular oocyte growth and acquisition of developmental competence. Anim. Reprod. Sci. 2003;78:203–216. doi: 10.1016/S0378-4320(03)00091-5. - DOI - PubMed
    1. Collado-Fernandez E., Picton H.M., Dumollard R. Metabolism throughout follicle and oocyte development in mammals. Int. J. Dev. Biol. 2012;56:799–808. doi: 10.1387/ijdb.120140ec. - DOI - PubMed
    1. Songsasen N. Energy metabolism regulating mammalian oocyte maturation. In: Swan A., editor. Meiosis—Molecular Mechanisms and Cytogenetic Diversity. InTech; Rijeka, Yugoslavia: 2012. pp. 173–186.
    1. Leroy J.L., Sturmey R.G., van Hoeck V., de Bie J., McKeegan P.J., Bols P.E. Dietary fat supplementation and the consequences for oocyte and embryo quality: Hype or significant benefit for dairy cow reproduction? Reprod. Domest. Anim. 2014;49:353–361. doi: 10.1111/rda.12308. - DOI - PubMed
    1. Ford J.H. Reduced quality and accelerated follicle loss with female reproductive aging—Does decline in theca dehydroepiandrosterone (DHEA) underlie the problem? J. Biomed. Sci. 2013;20:93. doi: 10.1186/1423-0127-20-93. - DOI - PMC - PubMed

LinkOut - more resources