. 2015 Mar 10;5(3):e523.
doi: 10.1038/tp.2015.14.

Fibroblasts from patients with major depressive disorder show distinct transcriptional response to metabolic stressors

Affiliations

Fibroblasts from patients with major depressive disorder show distinct transcriptional response to metabolic stressors

K A Garbett et al. Transl Psychiatry. .

Abstract

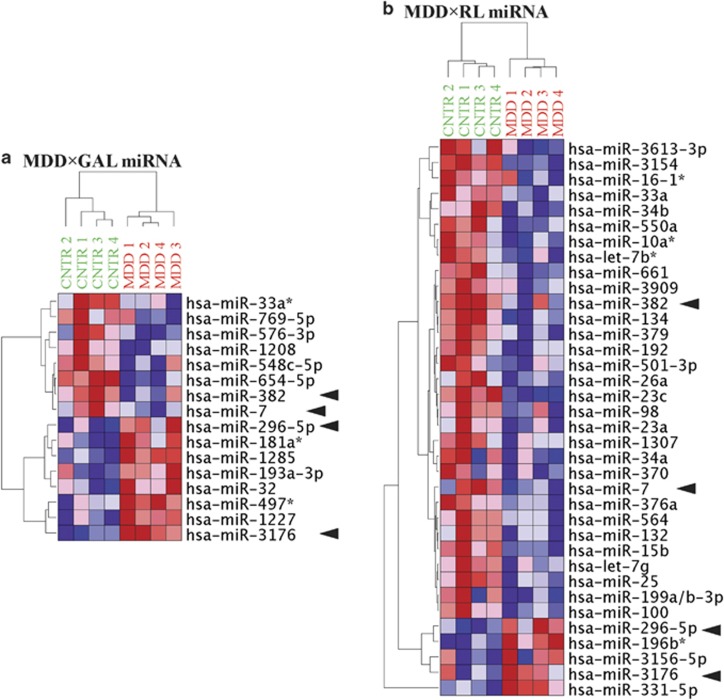
Major depressive disorder (MDD) is increasingly viewed as interplay of environmental stressors and genetic predisposition, and recent data suggest that the disease affects not only the brain, but the entire body. As a result, we aimed at determining whether patients with major depression have aberrant molecular responses to stress in peripheral tissues. We examined the effects of two metabolic stressors, galactose (GAL) or reduced lipids (RL), on the transcriptome and miRNome of human fibroblasts from 16 pairs of patients with MDD and matched healthy controls (CNTR). Our results demonstrate that both MDD and CNTR fibroblasts had a robust molecular response to GAL and RL challenges. Most importantly, a significant part (messenger RNAs (mRNAs): 26-33%; microRNAs (miRNAs): 81-90%) of the molecular response was only observed in MDD, but not in CNTR fibroblasts. The applied metabolic challenges uncovered mRNA and miRNA signatures, identifying responses to each stressor characteristic for the MDD fibroblasts. The distinct responses of MDD fibroblasts to GAL and RL revealed an aberrant engagement of molecular pathways, such as apoptosis, regulation of cell cycle, cell migration, metabolic control and energy production. In conclusion, the metabolic challenges evoked by GAL or RL in dermal fibroblasts exposed adaptive dysfunctions on mRNA and miRNA levels that are characteristic for MDD. This finding underscores the need to challenge biological systems to bring out disease-specific deficits, which otherwise might remain hidden under resting conditions.


Figures

Figure 1
Figure 1
Disease × stressor interaction mRNA signatures. (a) MDD × GAL and (b) MDD × RL. The ALR (MeanRL−MeanSTD) of the probes with significant disease × challenge interaction were subjected to unsupervised hierarchical clustering. The colored squares represent the increase (red) or decrease (blue) of each ALR from the mean. Color intensity is proportional to magnitude of change. Clear separation of MDD and CNTR groups was observed. Furthermore, two genes (INTS4 and N4BP2L1—denoted by arrows) are commonly present in both signatures. CNTR, control; GAL, galactose; MDD, major depressive disorder; mRNA, messenger RNA; RL, reduced lipid; STD, standard.
Figure 2
Figure 2
qPCR validation of the differential mRNA expression detected with microarrays. The differential expression of 10 mRNAs, detected with microarrays, was validated with custom qPCR arrays (groups: MDD, CNTR; culture conditions: STD, GAL, RL). ALR (ALRGAL=MeanGAL− MeanSTD, blue, ALRRL=MeanRL− MeanSTD, pink) was used as an estimate for the microarray expression changes and was plotted on the x axis. ΔΔCt (ΔΔCtGAL=ΔCtGAL−ΔCtSTD, blue; ΔΔCtRL=ΔCtRL−ΔCtSTD, pink) was used for a qPCR expression changes estimate and was plotted as −ΔΔCt on the y axis. Note that the estimates from both analyses in each comparison were highly correlated. CNTR, control; GAL, galactose; MDD, major depressive disorder; mRNA, messenger RNA; qPCR, quantitative PCR; RL, reduced lipid; STD, standard.
Figure 3
Figure 3
Differential miRNA expression in pooled samples is validated in individual samples. The expression level of 14 miRNAs, detected in miRNome analyses of pooled samples, was validated with independent qPCR arrays of individual samples (groups: MDD, CNTR; culture conditions: STD, GAL, RL). The expression changes, estimated with ΔΔCt (ΔΔCtGAL=ΔCtGAL−ΔCtSTD, blue; ΔΔCtRL=ΔCtRL−ΔCtSTD, pink), from the pooled samples are plotted on the x axis, and from the individual samples on the y axis. Note that the values from each comparison were highly correlated. CNTR, control; GAL, galactose; MDD, major depressive disorder; miRNA, microRNA; qPCR, quantitative PCR; RL, reduced lipid; STD, standard.
Figure 4
Figure 4
Disease × stressor interaction miRNA signatures. (a) MDD × GAL and (b) MDD × RL. The ΔΔCts (ΔΔCtGAL=ΔCtGAL−ΔCtSTD; ΔΔCtRL=ΔCtRL−ΔCtSTD) of the miRNAs with significant disease × challenge interaction were subjected to unsupervised hierarchical clustering. The colored squares represent the increase (red) or decrease (blue) of each ΔΔCt from the mean. Increased ΔΔCt represents reduced level of miRNA in metabolic stress compared with STD conditions. Clear separation of MDD and CNTR groups was observed. Four miRNAs (that is, miR-7, miR-382, miR-296-5p and miR-3176), denoted by arrows, are commonly present in both signatures. CNTR, control; GAL, galactose; MDD, major depressive disorder; miRNA, microRNA; RL, reduced lipid; STD, standard.

Similar articles

Cited by

References

    1. Verhoeven JE, Revesz D, Wolkowitz OM, Penninx BW. Cellular aging in depression: permanent imprint or reversible process? An overview of the current evidence, mechanistic pathways, and targets for interventions. Bioessays. 2014;36:968–978. - PubMed
    1. Klengel T, Binder EB. Gene-environment interactions in major depressive disorder. Can J Psychiatry. 2013;58:76–83. - PubMed
    1. Mahar I, Bambico FR, Mechawar N, Nobrega JN. Stress serotonin, and hippocampal neurogenesis in relation to depression and antidepressant effects. Neurosci Biobehav Rev. 2014;38:173–192. - PubMed
    1. Yang H, Yang T, Baur JA, Perez E, Matsui T, Carmona JJ, et al. Nutrient-sensitive mitochondrial NAD+ levels dictate cell survival. Cell. 2007;130:1095–1107. - PMC - PubMed
    1. Galluzzi L, Kepp O, Trojel-Hansen C, Kroemer G. Mitochondrial control of cellular life, stress, and death. Circ Res. 2012;111:1198–1207. - PubMed

Publication types