. 2015 Mar 10;10(3):e0120221.
doi: 10.1371/journal.pone.0120221. eCollection 2015.

Modeling the interaction between quinolinate and the receptor for advanced glycation end products (RAGE): relevance for early neuropathological processes

Affiliations

Modeling the interaction between quinolinate and the receptor for advanced glycation end products (RAGE): relevance for early neuropathological processes

Iris N Serratos et al. PLoS One. .

Expression of concern in

Abstract

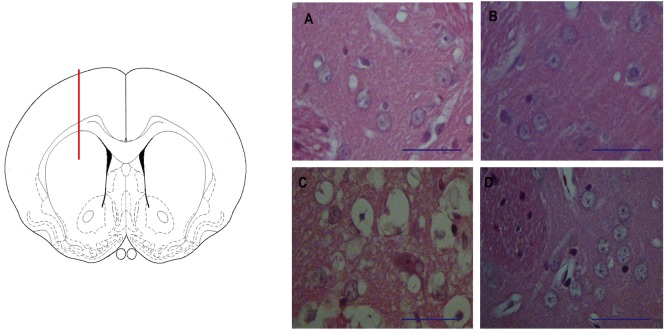
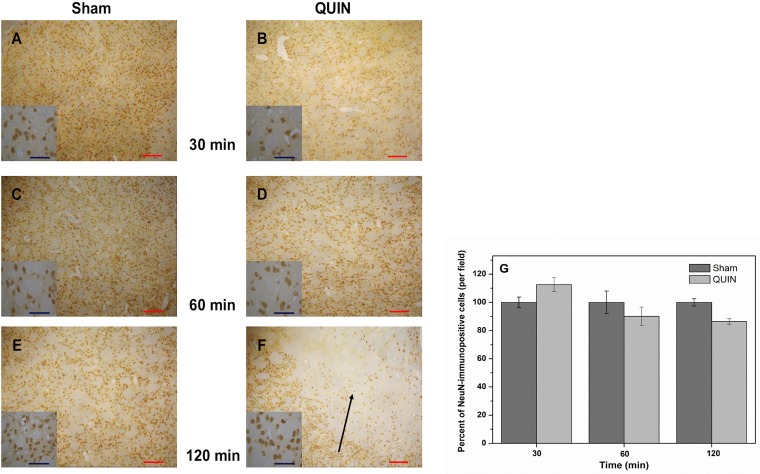
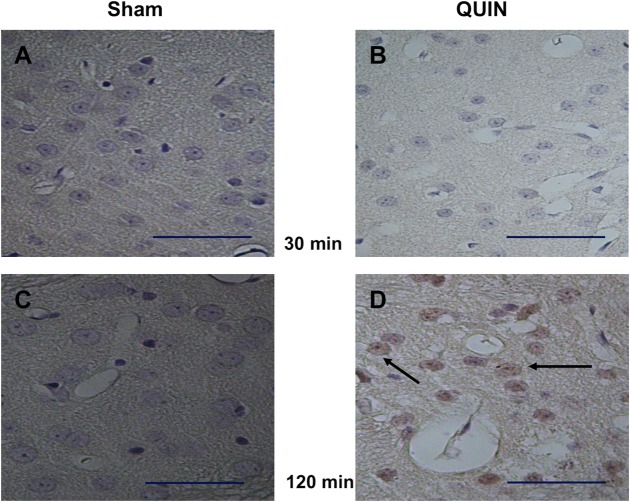
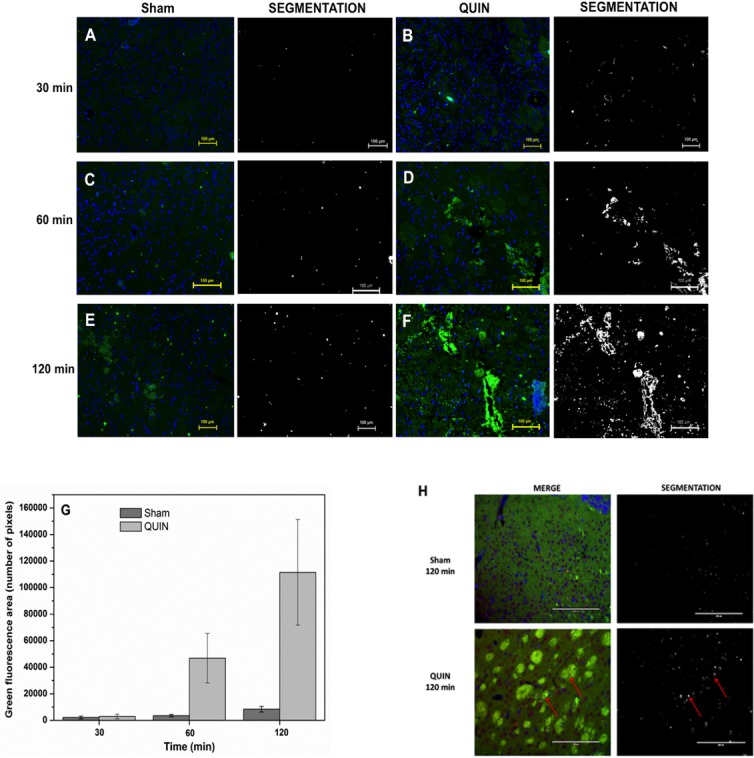
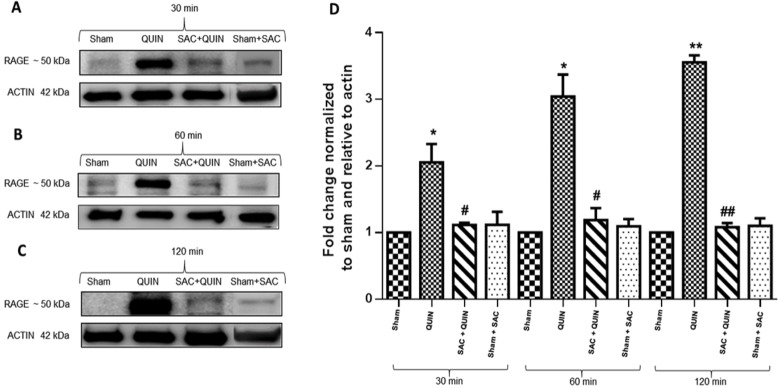
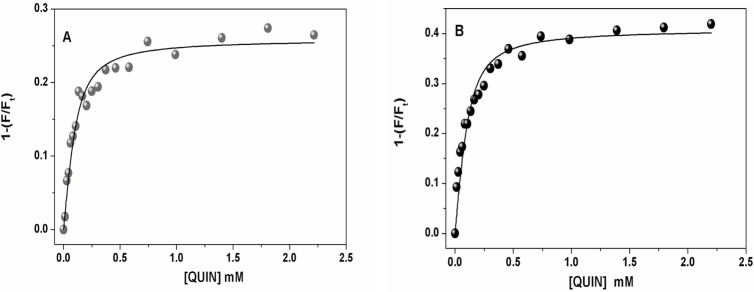
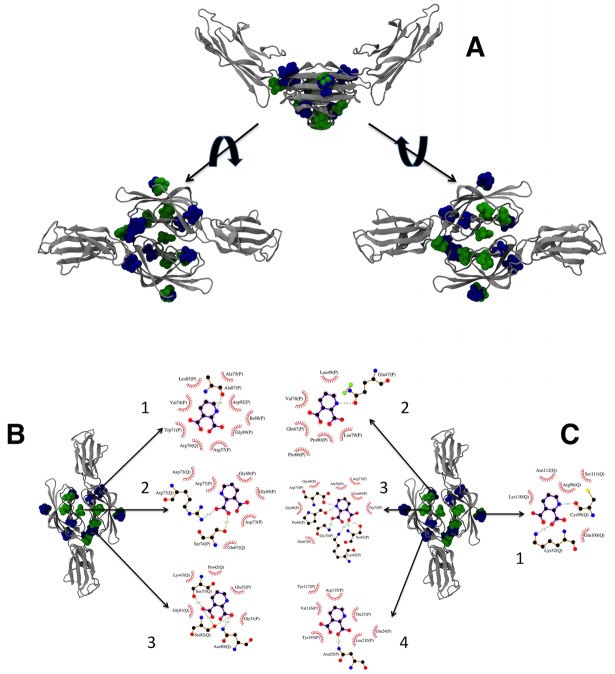
The receptor for advanced glycation end products (RAGE) is a pattern-recognition receptor involved in neurodegenerative and inflammatory disorders. RAGE induces cellular signaling upon binding to a variety of ligands. Evidence suggests that RAGE up-regulation is involved in quinolinate (QUIN)-induced toxicity. We investigated the QUIN-induced toxic events associated with early noxious responses, which might be linked to signaling cascades leading to cell death. The extent of early cellular damage caused by this receptor in the rat striatum was characterized by image processing methods. To document the direct interaction between QUIN and RAGE, we determined the binding constant (Kb) of RAGE (VC1 domain) with QUIN through a fluorescence assay. We modeled possible binding sites of QUIN to the VC1 domain for both rat and human RAGE. QUIN was found to bind at multiple sites to the VC1 dimer, each leading to particular mechanistic scenarios for the signaling evoked by QUIN binding, some of which directly alter RAGE oligomerization. This work contributes to the understanding of the phenomenon of RAGE-QUIN recognition, leading to the modulation of RAGE function.


Conflict of interest statement

Competing Interests: The authors have declared that no competing interests exist.

Figures

Fig 1
Fig 1. Molecular structure of quinolinic acid (QUIN).
QUIN and its conversion to a dianionic stucture (pK1 = 2.43 and pK2 = 4.78) [40] at pH 7.4. Each structure was built up with the program ACD/ChemSketch Freeware (http://www.acdlabs.com/resources/freeware/chemsketch/).
Fig 2
Fig 2. The striatal lesion induced by QUIN in rats.
In the left panel, a schematic representation of the lesion site (dorsal striatum) in a drawing of a coronal section of the rat brain is depicted. Red line represents the needle trajectory. In the right panel, A-D micrographs (40X) show striatal sections stained with Haemotoxylin & Eosin (Bar size 100 μm), where A corresponds to Sham (mechanically lesioned right striatum); B is the contralateral (unlesioned) striatum in the same animal; C shows the right striatum lesioned by QUIN (240 nmol/μl); and D depicts the contralateral unlesioned striatum from the same QUIN-infused rat. Sham and unlesioned striata (A, B and D) show neuronal cells without structural alterations, whereas the QUIN-lesioned striatum (C) exhibits morphological alterations nearby the lesion site that were characterized by diffuse vacuolization, pyknosis, edema and neuropil degeneration.
Fig 3
Fig 3. Histochemical alterations produced by QUIN in rats.
Peroxidase-based immunohistochemical staining of neuronal cells (NeuN) in striatal coronal sections (10X) of Sham (A, C and E)- and QUIN (B, D and F)- treated animals at different post-lesion times (Bar size 100 μm). Details of cell morphology for each treatment are shown in small squares (40X). The segmentation method was employed for cell counting, and expressed as immunopositive cells. In A, C and E, normal appearance of the striata with normal cell densities are shown. In B, D and F, the striatal appearance at 30, 60 and 120 min post-lesion is presented. Also in F, a considerable loss of neuronal density (indicated by arrow) can be appreciated close to the lesion site. In G, the numbers of immunopositive cells (mean percent ± SD), determined by the segmentation method, are graphically represented.
Fig 4
Fig 4. Histochemical labeling of RAGE-positive cells.
Peroxidase-based immunohistochemical staining of RAGE-positive cells in striatal coronal sections (40X) of Sham (A and C)- and QUIN (B and D)- treated animals at 30 and 120 min post-lesion, respectively (Bar size 100 μm). In D, a prominent reactivity of cells to RAGE (indicated by arrows) is observed.
Fig 5
Fig 5. Fluorescent labeling of RAGE.
Immunofluorescent localization of intracellular RAGE in the striatum of Sham (A, C and E)- and QUIN (B, D and F)-treated rats at different (30, 60 and 120 min) post-lesion times. RAGE is marked in green and cell nuclei (DAPI staining) in blue. Prominent immunofluorescence against RAGE was detected in D and F. In G, the density of immunopositive cells (mean green area ± SD) is graphically represented. In H, merge images showing the co-staining of nuclei (DAPI in blue and violet), neuronal cells (NeuN in red and violet) and RAGE (in green) in Sham and QUIN-lesioned striata at 120 min after the lesion. Arrows indicate triple co-localization. For all images, additional columns showing the marking process for quantification of the fluorescent labeling by the segmentation method are shown sidewise the treatment columns.
Fig 6
Fig 6. Immunoblot detection of RAGE.
QUIN-induced intracellular RAGE expression was suppressed by the antioxidant S-allylcysteine (SAC). In A, B and C, RAGE expression at 30, 60 and 120 min post-lesion in whole striatal extracts (35 μg protein/lane), respectively, is shown. Bands correspond to full-length (FL-RAGE) form of the protein (found around 50 kDa). Results are expressed as fold change compared with Sham. Each image represents three independent experiments. In D, the plot shows relative RAGE expression normalized to actin. Significant differences against Sham (*P<0.05 and **P<0.01) or QUIN (#P<0.05 and ##P<0.01) were considered. One-way ANOVA followed by Tukey’s test for multiple comparisons was used.
Fig 7
Fig 7. Titrations of VC1 with QUIN, monitored by fluorescence detection.
The initial protein concentration was 0.1 μM. Excitation was 280 nm and fluorescence emission was measured at 320 nm. Circles represent the fraction of total VC1 fluorescence (Ft) that is quenched by adding QUIN. Both titrations were done at 25°C in 20 mM Tris-base plus 133 mM NaCl at pH 7.4 (A) and in 20 mM glicine plus 133 mM NaCl at pH 9.0 (B). Data points were fitted to Equation (1) using nonlinear regression (solid line).
Fig 8
Fig 8. Docking for VC1-QUIN.
In A, the structures of the 20 highest scoring conformers of QUIN obtained by docking on all surfaces of VC1 human (green) and rat (blue) RAGE domains. The topmost figure shows the V-shaped dimer in silver ribbons, with the QUIN molecules in spheres. The left structure shows the dimer from the top, and the right structure, from the bottom. In B, the three binding sites that involve residues from both monomers are shown (labels 1, 2, and 3), together with the details of the interacting residues for the best pose of each site using LIGPLOT+ [74] with the default parameters. In C, the four binding sites that only involve residues from one monomer are shown (labels 1 through 4), together with details of the interacting residues for the best pose of each site using LIGPLOT+ [74] with the default parameters. The 3D structures were prepared with VMD 1.9.1 [75]. In panels B and C, residue names and numbers are followed by the chain identifier (P or Q). Hydrogen bonds are indicated by green dashed lines with the distance between heavy atoms, and van der Waals contacts are indicated by red arcs with short lines. Residue numbers correspond to the full chain numbering from rat or human.

References

    1. Coyle JT, Puttfarcken P. Oxidative stress, glutamate, and neurodegenerative disorders. Science 1993; 262: 689–695. - PubMed
    1. Olney JW. Excitotoxicity: an overview. Can Dis Wkly Rep Rapp Hebd Mal Au Can 1990; 16 Suppl 1E: 47–57; discussion 57–58. - PubMed
    1. Zádori D, Klivényi P, Szalárdy L, Fülöp F, Toldi J, Vécsei L. Mitochondrial disturbances, excitotoxicity, neuroinflammation and kynurenines: novel therapeutic strategies for neurodegenerative disorders. J Neurol Sci. 2012; 322: 187–191. 10.1016/j.jns.2012.06.004 - DOI - PubMed
    1. Essa MM, Braidy N, Vijayan KR, Subash S, Guillemin GJ. Excitotoxicity in the pathogenesis of autism. Neurotox Res. 2013; 23: 393–400. 10.1007/s12640-012-9354-3 - DOI - PubMed
    1. Stone TW, Mackay GM, Forrest CM, Clark CJ, Darlington LG. Tryptophan metabolites and brain disorders. Clin Chem Lab Med CCLM FESCC. 2003; 41: 852–859. - PubMed

Publication types

MeSH terms

Substances