

Attention and normalization circuits in macaque V1
- PMID: 25757941
- PMCID: PMC4402004
- DOI: 10.1111/ejn.12857
Attention and normalization circuits in macaque V1
Abstract
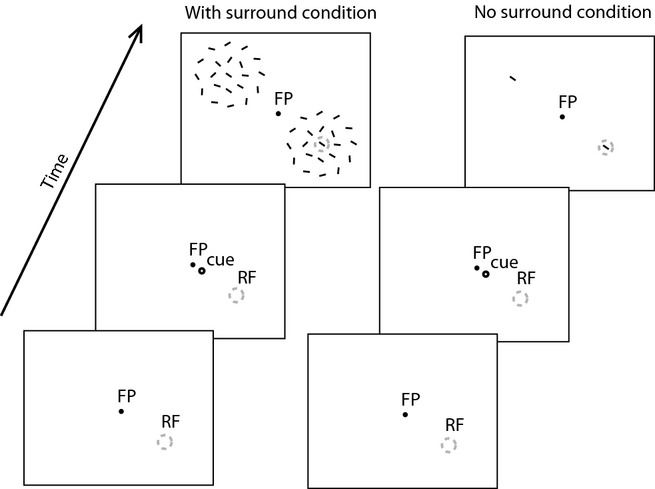
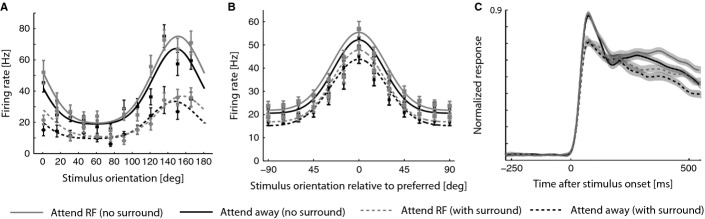
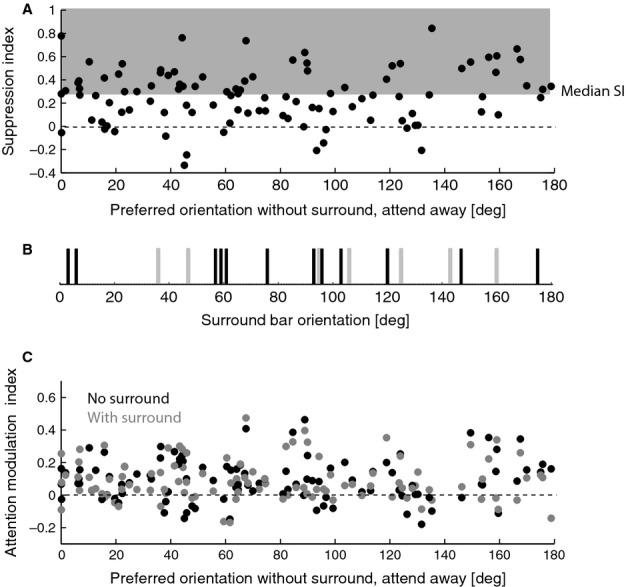
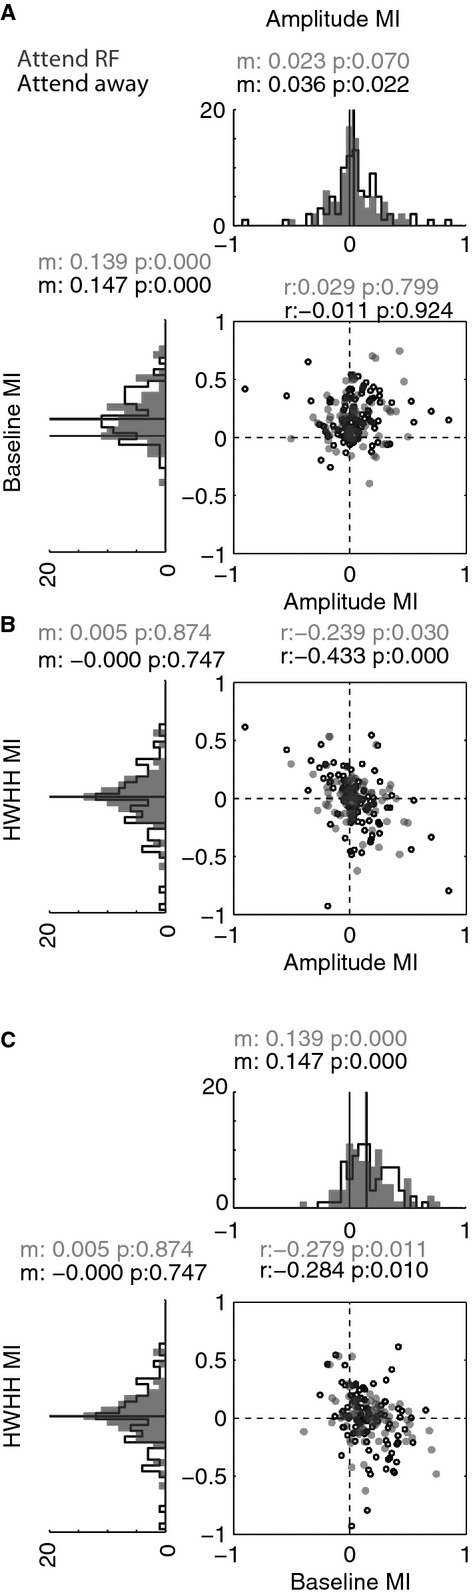
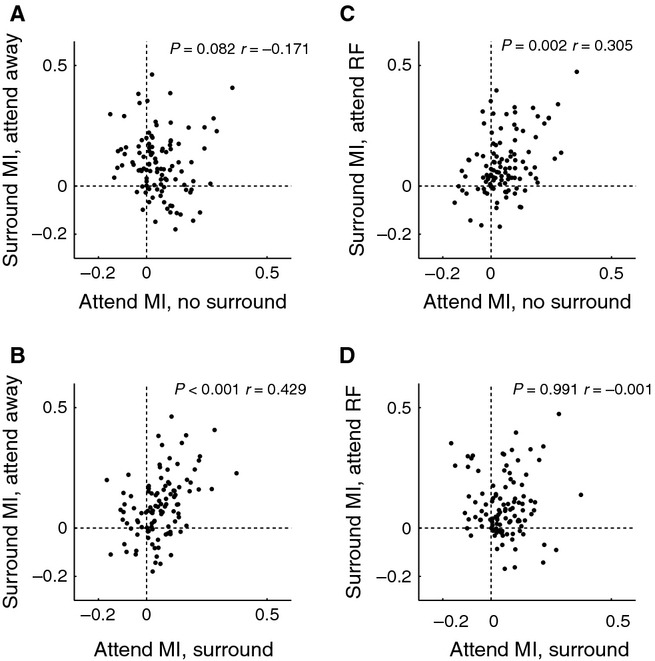
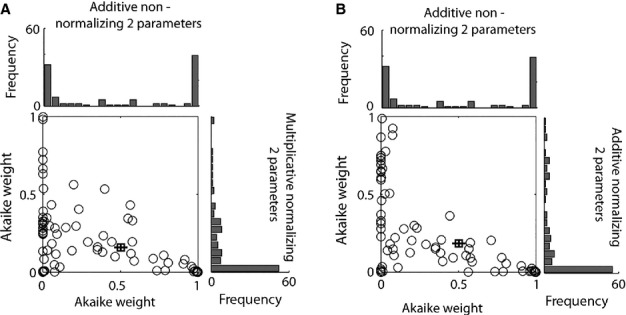
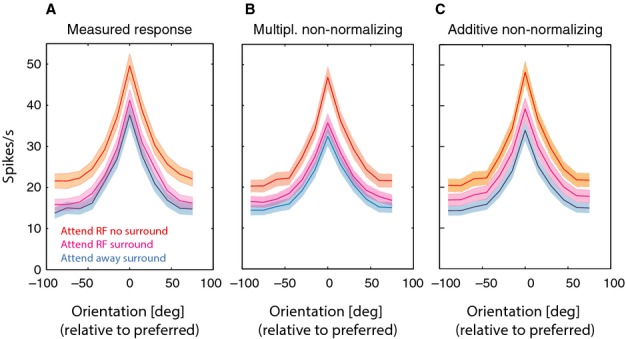
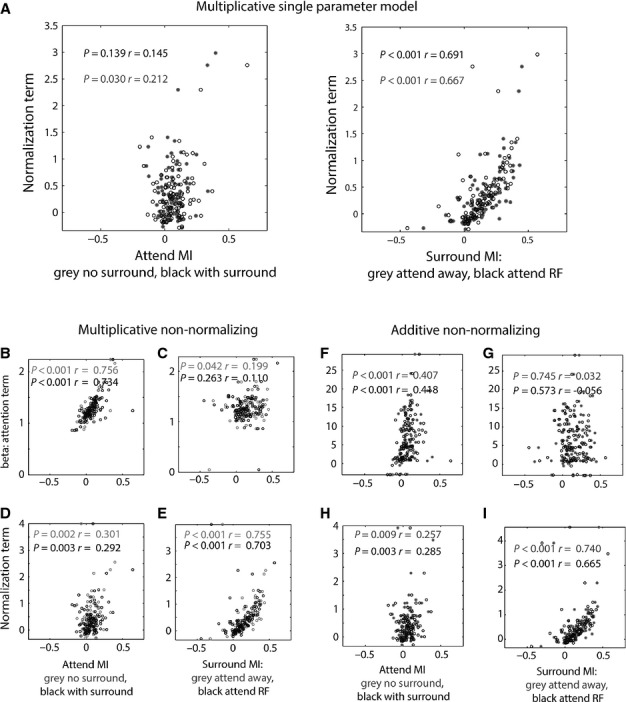
Attention affects neuronal processing and improves behavioural performance. In extrastriate visual cortex these effects have been explained by normalization models, which assume that attention influences the circuit that mediates surround suppression. While normalization models have been able to explain attentional effects, their validity has rarely been tested against alternative models. Here we investigate how attention and surround/mask stimuli affect neuronal firing rates and orientation tuning in macaque V1. Surround/mask stimuli provide an estimate to what extent V1 neurons are affected by normalization, which was compared against effects of spatial top down attention. For some attention/surround effect comparisons, the strength of attentional modulation was correlated with the strength of surround modulation, suggesting that attention and surround/mask stimulation (i.e. normalization) might use a common mechanism. To explore this in detail, we fitted multiplicative and additive models of attention to our data. In one class of models, attention contributed to normalization mechanisms, whereas in a different class of models it did not. Model selection based on Akaike's and on Bayesian information criteria demonstrated that in most cells the effects of attention were best described by models where attention did not contribute to normalization mechanisms. This demonstrates that attentional influences on neuronal responses in primary visual cortex often bypass normalization mechanisms.
Keywords: attention; normalization; orientation tuning; striate cortex; surround suppression.
© 2015 The Authors. European Journal of Neuroscience published by Federation of European Neuroscience Societies and John Wiley & Sons Ltd.
Figures
Similar articles
-
Different orientation tuning of near- and far-surround suppression in macaque primary visual cortex mirrors their tuning in human perception.J Neurosci. 2013 Jan 2;33(1):106-19. doi: 10.1523/JNEUROSCI.2518-12.2013. J Neurosci. 2013. PMID: 23283326 Free PMC article.
-
Comparison of spatial summation properties of neurons in macaque V1 and V2.J Neurophysiol. 2009 Oct;102(4):2069-83. doi: 10.1152/jn.00512.2009. Epub 2009 Aug 5. J Neurophysiol. 2009. PMID: 19657084 Free PMC article.
-
Attention operates uniformly throughout the classical receptive field and the surround.Elife. 2016 Aug 22;5:e17256. doi: 10.7554/eLife.17256. Elife. 2016. PMID: 27547989 Free PMC article.
-
Contribution of feedforward, lateral and feedback connections to the classical receptive field center and extra-classical receptive field surround of primate V1 neurons.Prog Brain Res. 2006;154:93-120. doi: 10.1016/S0079-6123(06)54005-1. Prog Brain Res. 2006. PMID: 17010705 Review.
-
Surround suppression supports second-order feature encoding by macaque V1 and V2 neurons.Vision Res. 2014 Nov;104:24-35. doi: 10.1016/j.visres.2014.10.004. Epub 2014 Oct 23. Vision Res. 2014. PMID: 25449336 Free PMC article. Review.
Cited by
-
Muscarinic and Nicotinic Contribution to Contrast Sensitivity of Macaque Area V1 Neurons.Front Neural Circuits. 2017 Dec 19;11:106. doi: 10.3389/fncir.2017.00106. eCollection 2017. Front Neural Circuits. 2017. PMID: 29311843 Free PMC article.
-
Attentional modulation of neuronal variability in circuit models of cortex.Elife. 2017 Jun 7;6:e23978. doi: 10.7554/eLife.23978. Elife. 2017. PMID: 28590902 Free PMC article.
-
Neuromodulation of Attention.Neuron. 2018 Feb 21;97(4):769-785. doi: 10.1016/j.neuron.2018.01.008. Neuron. 2018. PMID: 29470969 Free PMC article. Review.
-
Low rank mechanisms underlying flexible visual representations.Proc Natl Acad Sci U S A. 2020 Nov 24;117(47):29321-29329. doi: 10.1073/pnas.2005797117. Proc Natl Acad Sci U S A. 2020. PMID: 33229536 Free PMC article.
-
Attention Induced Gain Stabilization in Broad and Narrow-Spiking Cells in the Frontal Eye-Field of Macaque Monkeys.J Neurosci. 2016 Jul 20;36(29):7601-12. doi: 10.1523/JNEUROSCI.0872-16.2016. J Neurosci. 2016. PMID: 27445139 Free PMC article.
References
-
- Akaike H. Data analysis by statistical models. Brain Dev.-Jpn. 1992;24:127–133. - PubMed
-
- Albrecht DG, Geisler WS, Frazor RA. Crane AM. Visual cortex neurons of monkeys and cats: temporal dynamics of the contrast response function. J. Neurophysiol. 2002;88:888–913. &. - PubMed
-
- Anderson JS, Carandini M. Ferster D. Orientation tuning of input conductance, excitation, and inhibition in cat primary visual cortex. J. Neurophysiol. 2000;84:909–926. &. - PubMed
-
- Angelucci A, Levitt JB. Lund JS. Anatomical origins of the classical receptive field and modulatory surround field of single neurons in macaque visual cortical area V1. Prog. Brain Res. 2002;136:373–388. &. - PubMed
Publication types
MeSH terms
Grants and funding
LinkOut - more resources
Full Text Sources
Other Literature Sources
