Multicenter Study
. 2015 Aug 15;32(16):1254-71.
doi: 10.1089/neu.2014.3547. Epub 2015 May 6.

Abnormal White Matter Blood-Oxygen-Level-Dependent Signals in Chronic Mild Traumatic Brain Injury

Affiliations
Multicenter Study

Abnormal White Matter Blood-Oxygen-Level-Dependent Signals in Chronic Mild Traumatic Brain Injury

Serguei V Astafiev et al. J Neurotrauma. .

Abstract

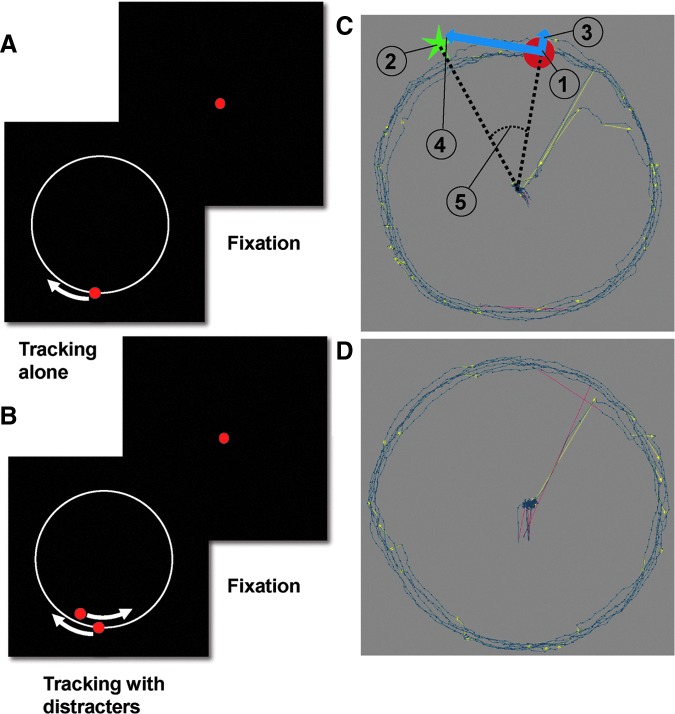
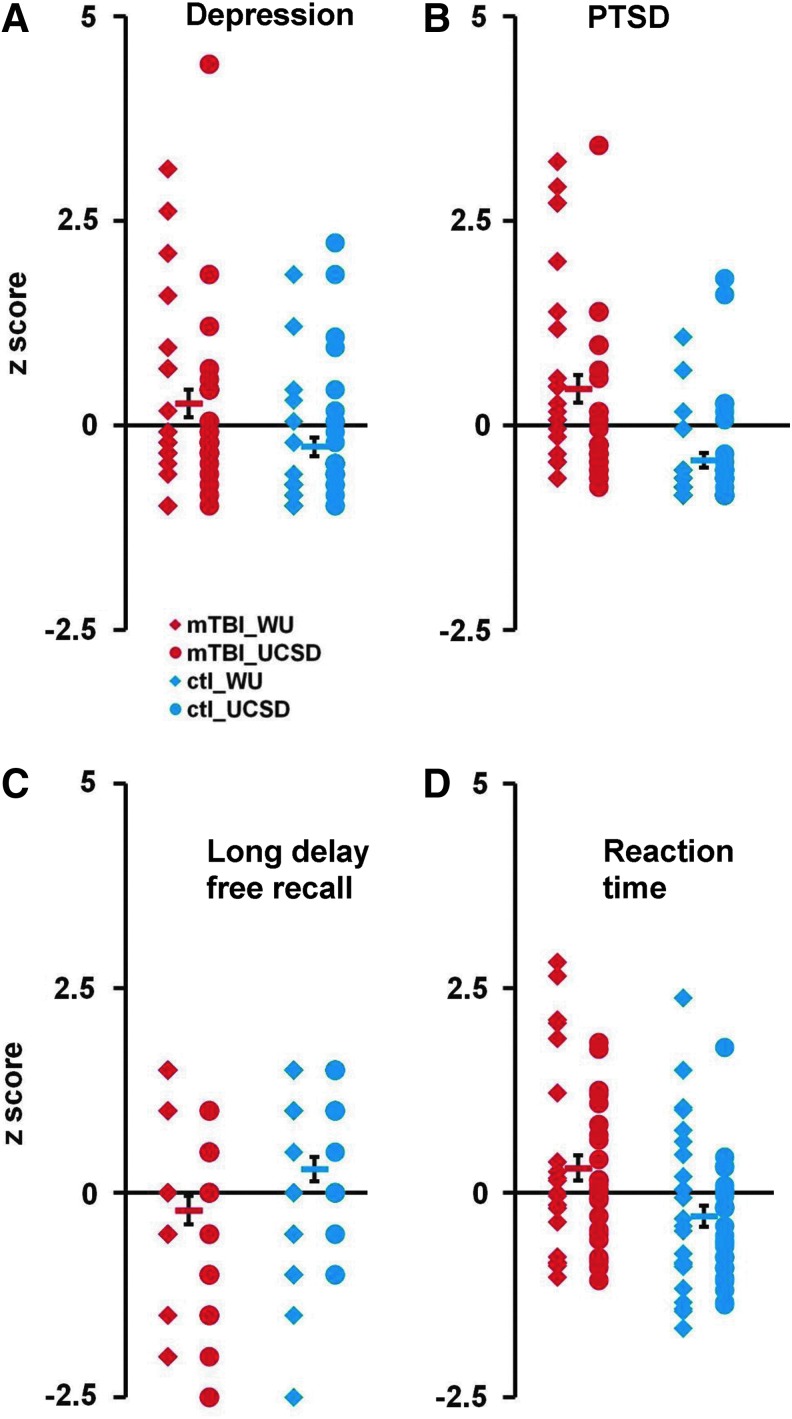
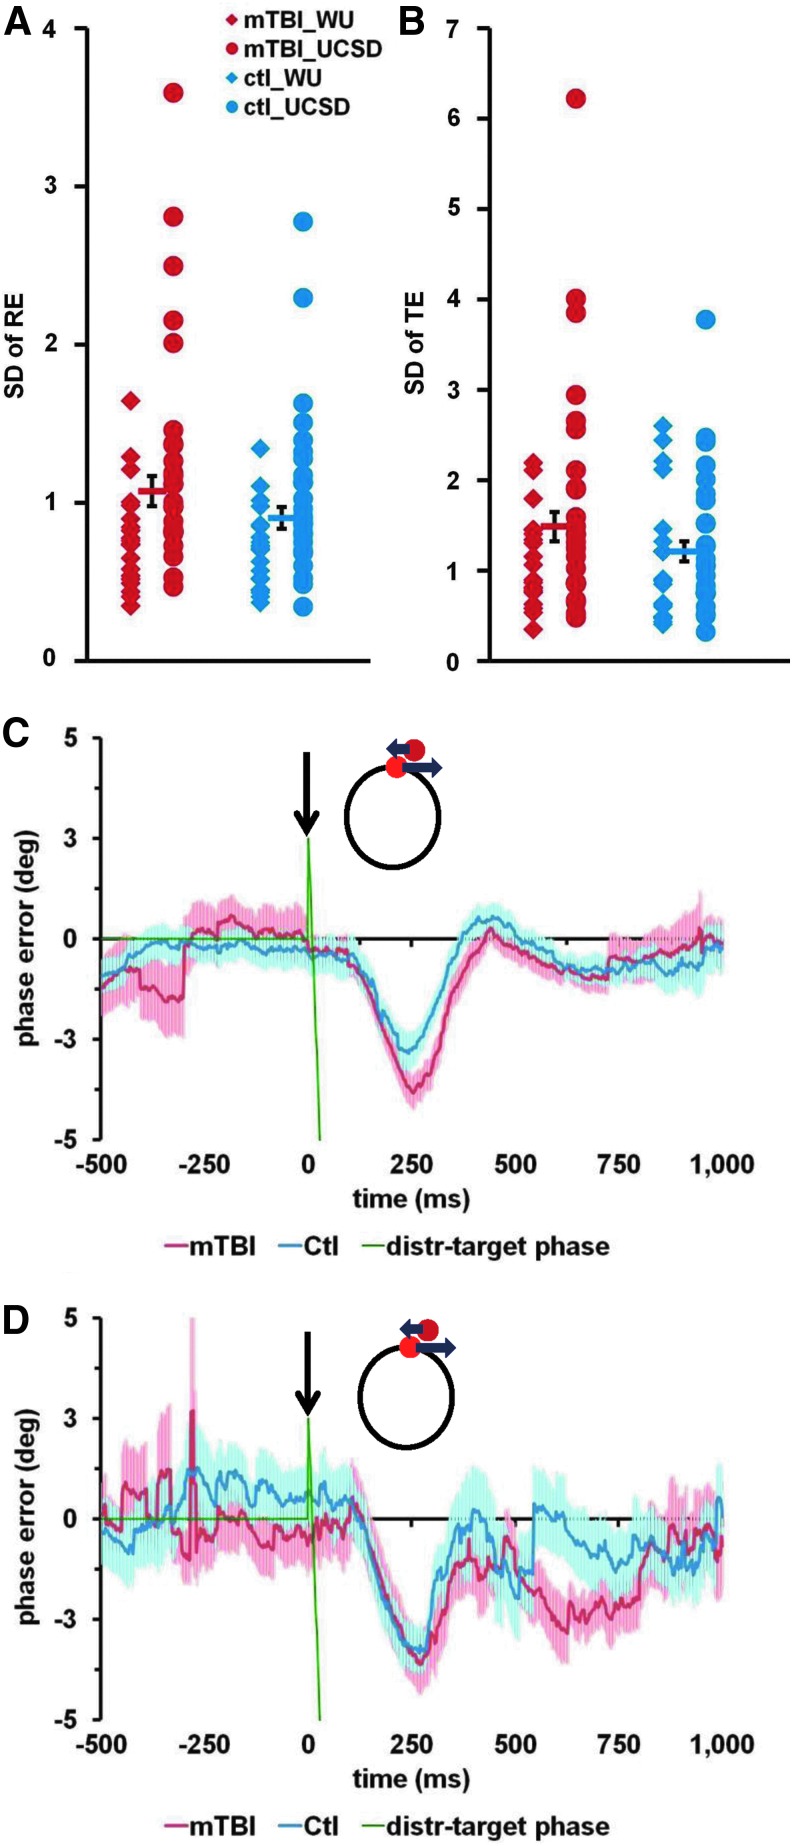
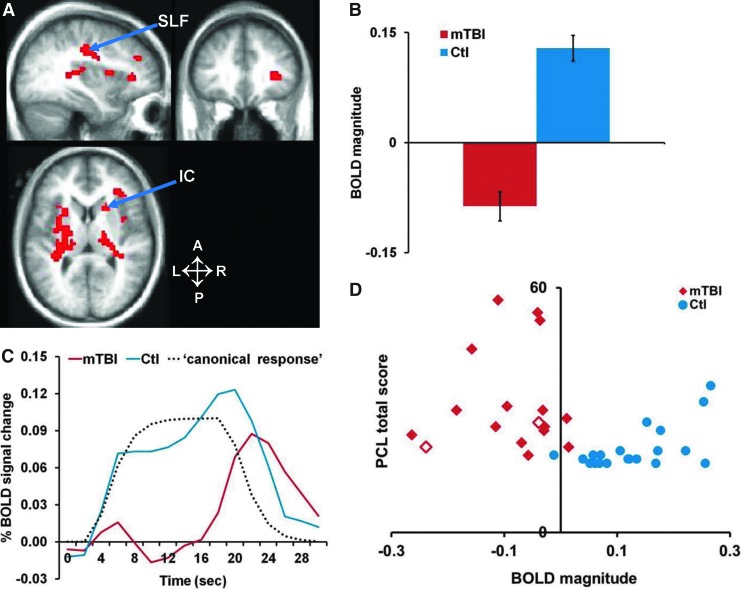
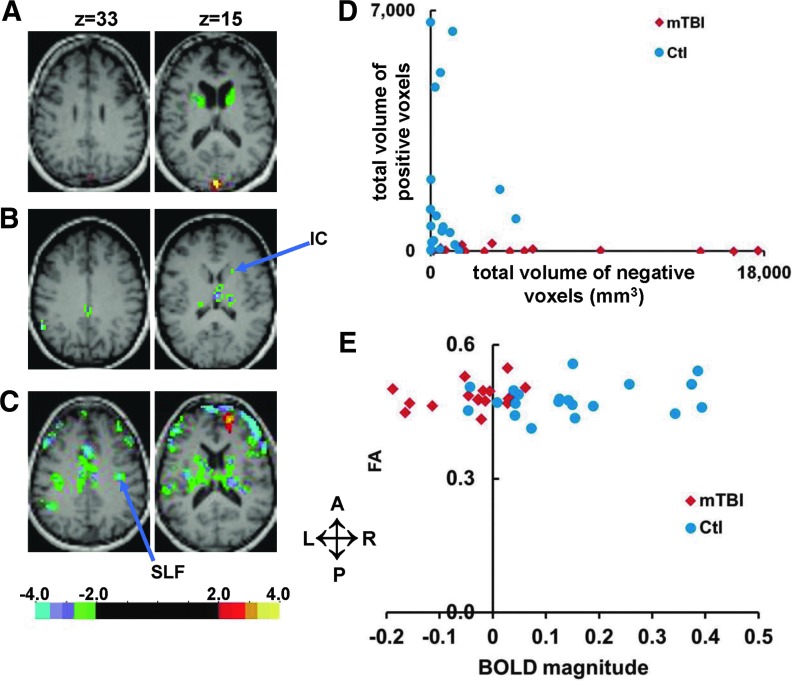
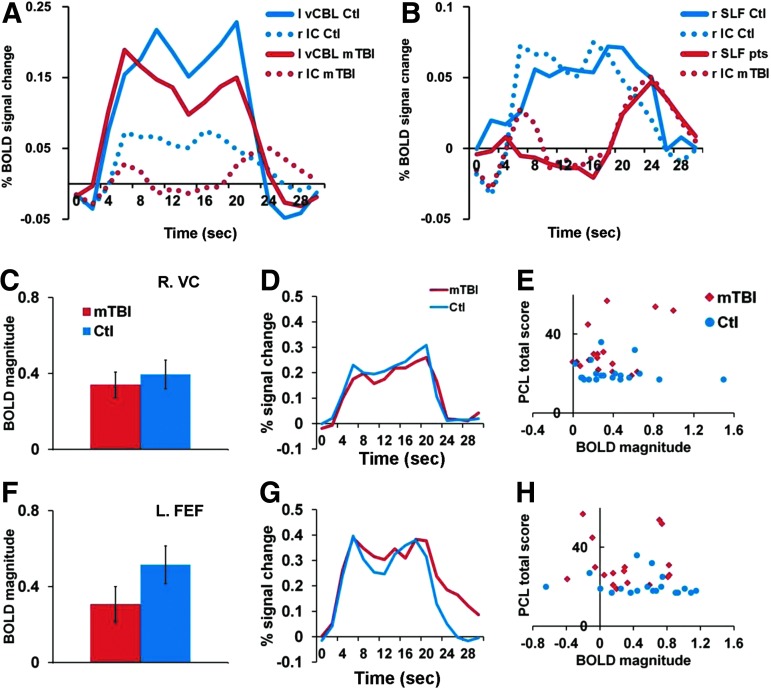
Concussion, or mild traumatic brain injury (mTBI), can cause persistent behavioral symptoms and cognitive impairment, but it is unclear if this condition is associated with detectable structural or functional brain changes. At two sites, chronic mTBI human subjects with persistent post-concussive symptoms (three months to five years after injury) and age- and education-matched healthy human control subjects underwent extensive neuropsychological and visual tracking eye movement tests. At one site, patients and controls also performed the visual tracking tasks while blood-oxygen-level-dependent (BOLD) signals were measured with functional magnetic resonance imaging. Although neither neuropsychological nor visual tracking measures distinguished patients from controls at the level of individual subjects, abnormal BOLD signals were reliably detected in patients. The most consistent changes were localized in white matter regions: anterior internal capsule and superior longitudinal fasciculus. In contrast, BOLD signals were normal in cortical regions, such as the frontal eye field and intraparietal sulcus, that mediate oculomotor and attention functions necessary for visual tracking. The abnormal BOLD signals accurately differentiated chronic mTBI patients from healthy controls at the single-subject level, although they did not correlate with symptoms or neuropsychological performance. We conclude that subjects with persistent post-concussive symptoms can be identified years after their TBI using fMRI and an eye movement task despite showing normal structural MRI and DTI.

Keywords: MRI; behavioral assessments; diffusion tensor imaging; traumatic brain injury.


Figures

<b>FIG. 1.</b>
FIG. 1.
A schematic illustration of eye movement tasks and dependent measures. (A) Tracking Alone task. The red dot indicates the target dot the subject was instructed to follow. The white circle (not visible in actual display) indicates the target path while the white arrow (not visible in actual display) indicates the direction of target motion. The red dot at the center of the Fixation frame indicates the dot on which the subject was instructed to fixate between trials of smooth pursuit tracking. (B) Tracking with Distracters task. The red dot inside the white circle indicates the distracter dot, which in this example moves in the direction opposite to that of the target dot. (C) Sample eye traces (blue lines) for a mild traumatic brain injury patient and schematic display of dependent measures computed from the eye data. Yellow directional lines mark saccades. Red lines mark a blink. (1) The red target that the subject was instructed to track; (2) eye position; (3) radial (4) and tangential vectorial components of eye position error (distance between target position and eye position); and (5) phase error (phase difference between the eye and target positions). (D) Sample eye traces for matched control subject. Color image is available online at www.liebertpub.com/neu
<b>FIG. 2.</b>
FIG. 2.
Neuropsychological test scores in mild traumatic brain injury (mTBI) patients and controls. (A-D) Distribution of test scores (converted into Z-scores) for depression (Center for Epidemiologic Studies Depression scale: A) post-traumatic stress disorder (PTSD; PTSD Checklist scale total); (B) working verbal memory (California Verbal Learning Test-Second Edition long delay free recall score; and (C) and reaction time (Attention Network Test, overall reaction time); (D) Red diamonds display the scores from Washington University (Wash. U.). Mild TBI patients, red circles display the scores from University of California, San Diego (UCSD) mTBI patients; blue diamonds and blue circles display the scores from Wash. U. and UCSD matched control subjects, respectively. Red and blue bars indicate the mean scores for mTBI patients and control subjects, respectively. Error bars represent standard error of the mean. Color image is available online at www.liebertpub.com/neu
<b>FIG. 3.</b>
FIG. 3.
Visual tracking errors analysis. Distributions of the variability of visual tracking errors and average time-courses of mean phase error. (A) Standard deviation (SD) of radial error (SD of RE; in degrees of visual angle) during Tracking Alone task. (B) SD of tangential error (SD of TE; in degrees of visual angle) during Tracking Alone task. (C and D) Average time-courses of mean phase error during the Tracking with Distracters task. Data are shown for the distracter type with Initial position ahead (+2.5°), speed slower than target (0.34 Hz) and counterclockwise direction, based on the data collected at Washington University (C) and University of California, San Diego (D). The black arrow indicates the time of distracter onset. Green line represents the difference between the distracter phase and target phase. Red and blue lines represent mean phase error for mild traumatic brain injury (mTBI) patients and control subjects, respectively. Red and blue shaded areas represent standard error of the mean for mTBI patients and control subjects, respectively. Color image is available online at www.liebertpub.com/neu
<b>FIG. 4.</b>
FIG. 4.
Functional magnetic resonance imaging activation during tracking tasks in mild traumatic brain injury (mTBI) patients and matched controls. (A and B) Selected brain slices with overlapping statistical map representing z values of one sample voxelwise t-test that compared tracking (collapsed over tasks) vs. fixation for matched control subjects (A) and for mTBI patients (B). Warm colors indicate activations that are stronger during tracking than during fixation. Cold colors represent activations that are stronger during fixation than during tracking. (C) The same brain slices with overlapping statistical map show z values for the main effect of group from a voxelwise analysis of variance. (Controls vs. mTBI patients, collapsed over task). Color scales indicate z-statistic. WM, white matter; Put, putamen, IC, internal capsule; vCBL, cerebellar vermis; vIPS, ventral IPS; MT+, middle temporal complex; L, left; R, right; A, anterior; P, posterior. Color image is available online at www.liebertpub.com/neu
<b>FIG. 5.</b>
FIG. 5.
Magnitudes and time-courses from large region of interest (ROI). Magnitudes and time-courses extracted from voxels demonstrating significant differences between patients and controls. (A) Selected brain slices showing voxels with a significantly reduced blood-oxygen-level–dependent BOLD signal in mild traumatic brain injury (mTBI) patients relative to controls. The set of all voxels showing significant differences formed an “abnormal” ROI. L, left; R, right; A, anterior; P, posterior. (B) BOLD magnitudes from the abnormal ROI, averaged across tasks. Error bars represent standard error of the mean. (C) The time-course of the BOLD signal in the abnormal ROI. The canonical hemodynamic response function (HRF) used in the analysis to compute the BOLD magnitudes also is shown (labeled “canonical response”). (D) Scatter plot of BOLD magnitude values from the abnormal ROI for mTBI patients (red diamond) and controls (blue circles) vs. PCL-C (Post-traumatic Stress Disorder Checklist) total score. “Complex mTBI” (mTBI patients with positive radiological findings and/or antegrade post-traumatic amnesia longer than 24 h are indicated by open diamonds. Color image is available online at www.liebertpub.com/neu
<b>FIG. 6.</b>
FIG. 6.
(A-C) Selected transversal slices showing significant (p<0.05; z ≥2.25, cluster size of 53 voxels) voxelwise statistical z-maps for three mild traumatic brain injury (mTBI) patients superimposed on the patients' magnetization prepared gradient-echo. Negative values represent a significantly smaller BOLD magnitude in the mTBI patient, compared with 20 control subjects. L, left; R, right; A, anterior; P, posterior. (D) The total volume (mm3) of significantly (z ≥2.25 without multiple comparison correction) positive (X axis) and negative voxels (Y axis) inside the abnormal region of interest for each patient and control subject. (E) Scatter plots of magnitude values for mTBI patients and controls (X axis) vs. FA values (Y axis) for the same white matter voxels inside right anterior IC. Color image is available online at www.liebertpub.com/neu
<b>FIG. 7.</b>
FIG. 7.
Magnitudes and time-courses extracted from visual and attention regions in patients and controls. (A) The time-courses of the blood-oxygen-level–dependent (BOLD) signal from left cerebellar vermis (vCBL; solid lines) and right anterior IC (dotted lines) in mild traumatic brain injury (mTBI) patients (red lines) and control subjects (blue lines). (B) The time-courses of the BOLD signal from right superior longitudinal fasciculus (SLF; solid lines) and right anterior internal capsule (IC; dotted lines) in mTBI patients (red lines) and control subjects (blue lines). (C, F) BOLD magnitudes averaged across tasks from right visual cortex (C), and left frontal eye field (FEF; F). Error bars represent standard error of the mean. (D, G) BOLD time-courses averaged across tasks from right visual cortex (D) and left FEF (G). (E, H) Scatter plots of BOLD magnitude values for mTBI patients (red diamond) and controls (blue circles) vs. Post-Traumatic Stress Disorder Checklist (PCL) total score from right visual cortex (E) and left FEF (H). Color image is available online at www.liebertpub.com/neu

References

    1. Coronado V.G., McGuire L.C., Faul M., Sugerman D., and Pearson W. (2012). The Epidemiology and Prevention of TBI (in press)
    1. Narayan R.K., Michel M.E., Ansell B., Baethmann A., Biegon A., Bracken M.B., Bullock M.R., Choi S.C., Clifton G.L., Contant C.F., Coplin W.M., Dietrich W.D., Ghajar J., Grady S.M., Grossman R.G., Hall E.D., Heetderks W., Hovda D.A., Jallo J., Katz R.L., Knoller N., Kochanek P.M., Maas A.I., Majde J., Marion D.W., Marmarou A., Marshall L.F., McIntosh T.K., Miller E., Mohberg N., Muizelaar J.P., Pitts L.H., Quinn P., Riesenfeld G., Robertson C.S., Strauss K.I., Teasdale G., Temkin N., Tuma R., Wade C., Walker M.D., Weinrich M., Whyte J., Wilberger J., Young A.B., and Yurkewicz L. (2002). Clinical trials in head injury. J. Neurotrauma 19, 503–557 - PMC - PubMed
    1. Ghajar J. (2000). Traumatic brain injury. Lancet 356, 923–929 - PubMed
    1. Kushner D. (1998). Mild traumatic brain injury: toward understanding manifestations and treatment. Arch. Intern. Med. 158, 1617–1624 - PubMed
    1. Gerber D.J. and Schraa J.C. (1995). Mild traumatic brain injury: searching for the syndrome. J. Head Trauma Rehabil. 10, 28–40

Publication types