. 2015 Mar 15;142(6):1050-61.
doi: 10.1242/dev.119180.

Gata2b is a restricted early regulator of hemogenic endothelium in the zebrafish embryo

Affiliations

Gata2b is a restricted early regulator of hemogenic endothelium in the zebrafish embryo

Emerald Butko et al. Development. .

Abstract

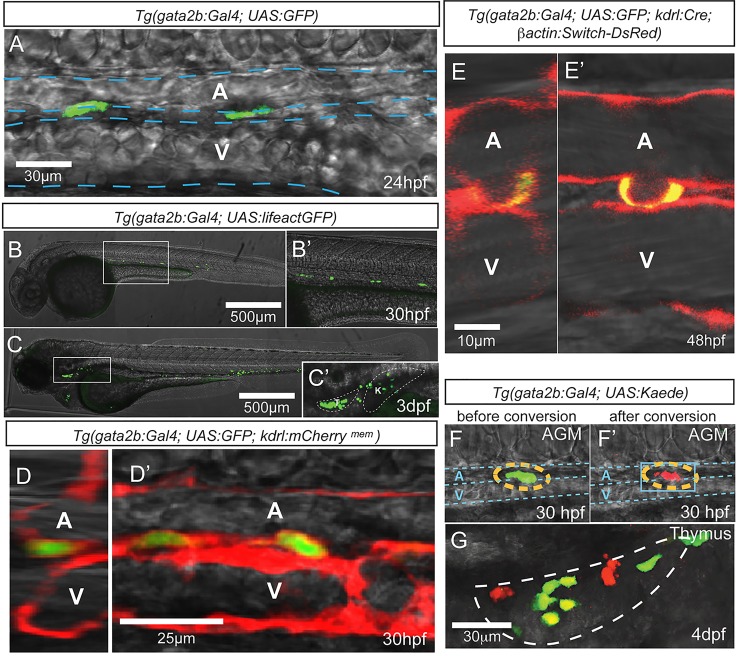
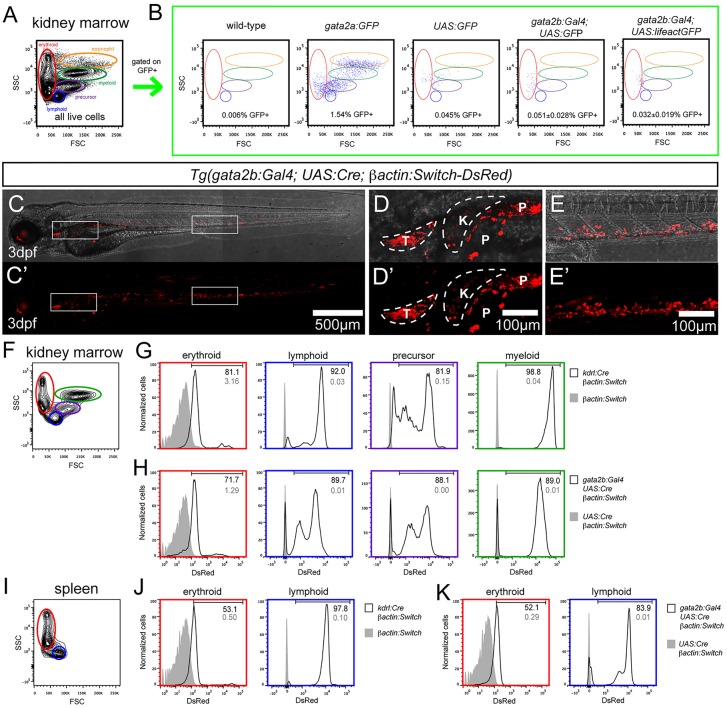
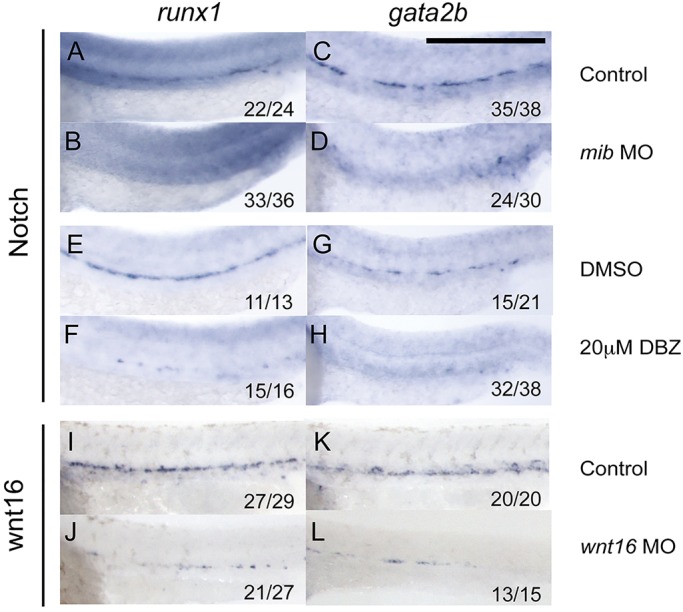
The adult blood system is established by hematopoietic stem cells (HSCs), which arise during development from an endothelial-to-hematopoietic transition of cells comprising the floor of the dorsal aorta. Expression of aortic runx1 has served as an early marker of HSC commitment in the zebrafish embryo, but recent studies have suggested that HSC specification begins during the convergence of posterior lateral plate mesoderm (PLM), well before aorta formation and runx1 transcription. Further understanding of the earliest stages of HSC specification necessitates an earlier marker of hemogenic endothelium. Studies in mice have suggested that GATA2 might function at early stages within hemogenic endothelium. Two orthologs of Gata2 exist in zebrafish: gata2a and gata2b. Here, we report that gata2b expression initiates during the convergence of PLM, becoming restricted to emerging HSCs. We observe Notch-dependent gata2b expression within the hemogenic subcompartment of the dorsal aorta that is in turn required to initiate runx1 expression. Our results indicate that Gata2b functions within hemogenic endothelium from an early stage, whereas Gata2a functions more broadly throughout the vascular system.

Keywords: Gata2; Hematopoietic stem cell; Hemogenic endothelium; Notch; Subfunctionalization.


Figures

Fig. 1.
Fig. 1.
Homology of Gata2a and Gata2b proteins. Alignment of amino acid sequences of human GATA2, murine GATA2, and zebrafish Gata2a and Gata2b sequences. Residues conserved in all four proteins are highlighted in blue. Residues conserved between human GATA2, murine GATA2 and zebrafish Gata2a are highlighted in green. Residues conserved between human GATA2, murine GATA2 and zebrafish Gata2b are highlighted in purple.
Fig. 2.
Fig. 2.
Zebrafish gata2b is expressed in hemogenic endothelium. (A) Expression of gata2b in whole embryos over time. cDNA isolated from 20-30 pooled embryos per timepoint. Error bars indicate s.e.m. of three biological samples. (B-G) Whole-mount in situ hybridization (WISH) of gata2b expression at the indicated stages. Yellow arrowheads indicate expression in the vascular cord region (C) and dorsal aorta (DA) (D,E). Blue arrowheads indicate branchiomotor neurons (D-F). Pink arrowheads indicate expression in the caudal hematopoietic tissue (CHT) (F,G). (H) qPCR of gata2b expression in GFP+ cells isolated from fli1a:GFP embryos by FACS. n.d., not detected. GFP+ cells sorted from 20-30 pooled embryos per timepoint. Error bars indicate s.e.m. of three technical replicates. (I) Transverse trunk sections showing WISH for gata2b at 18 hpf. Top, rare cell detected outside the midline (asterisk). Bottom, representative section with gata2b+ cell localized to the midline. (J-M) Transverse sections showing WISH for gata2b (J), runx1 (K), kdrl (L) and gata2a (M) at 25 hpf. Pink dashed ovals indicate the DA; orange dashed ovals indicate the posterior cardinal vein (PCV). Yellow arrowhead indicates a primitive erythrocyte. (N) Quantitation of gata2a and gata2b transcripts in kdrl+ cmyb and kdrl+ cmyb+ cells from 36 hpf and 48 hpf kdrl:mCherrymem;cmyb:GFP embryos. Cells isolated from 50-100 pooled embryos per sample. Two biological experiments were performed for each timepoint, with one representative shown. Error bars indicate s.e.m. of three technical replicates for each representative experiment.
Fig. 3.
Fig. 3.
Tg(gata2b:Gal4) marks hemogenic endothelial cells. Imaging is by confocal microscopy. (A) GFP+ endothelial cells in the trunk region of a gata2b:Gal4;UAS:GFP embryo at 24 hpf. (B-C′) gata2b:Gal4;UAS:lifeactGFP at 30 hpf and 3 dpf. (C′) An enlarged view of C, with thymus and kidney highlighted. (D,D′) Transverse (D) and lateral (D′) views of the trunk vasculature of 30 hpf gata2b:Gal4;UAS:GFP;kdrl:mCherrymem. (E,E′) Transverse (E) and lateral (E′) views of a 48 hpf gata2b:Gal4;UAS:GFP;kdrl:Cre;actB2:LoxP-STOP-LoxP-DsRedEx embryo showing a GFP+ cell undergoing EHT. (F,F′) A representative Kaede+ cell in the trunk of a gata2b:Gal4;UAS:Kaede embryo before (F) and after (F′) photoconversion. Blue dashed lines indicate the approximate location of DA and PCV. (G) Thymus of a 4 dpf gata2b:Gal4;UAS:Kaede embryo that experienced photoconversion of a single aortic gata2b+ cell in the trunk at 46 hpf. White dashed line highlights the thymus region. T, thymus; K, kidney; A, aorta; V, vein.
Fig. 4.
Fig. 4.
gata2b+ cells give rise to adult blood. (A,B) Analysis of GFP+ cells in the whole kidney marrow (WKM). (A) Representative flow cytometry analysis of the adult WKM, including the distribution of erythroid (red), lymphoid (blue), precursor (purple), myeloid (green) and eosinophil (orange) populations. (B) Percentage and distribution of GFP+ cells from the WKM of adult zebrafish of the indicated genotypes. Scatter plots depict the forward and side scatter distribution of GFP+ cells from the WKM, with populations marked as in A for reference. For wild type (n=1), gata2a:GFP (n=2) and UAS:GFP (n=2), the indicated percentage corresponds to the representative scatter plot. For gata2b:Gal4;UAS:GFP (n=3) and gata2b:Gal4;UAS:lifeactGFP (n=3), a representative scatter plot is shown and the indicated percentage of GFP+ cells corresponds to the average±s.d. (C-E′) gata2b:Gal4;UAS:Cre;βactin:Switch-DsRed embryo at 3 dpf. (C,C′) DsRed fluorescence in the whole embryo. (D,D′) Enlarged view of thymus (T) and kidney (K) region from C,C′; P, pigment. (E,E′) Enlarged view of the CHT region from C,C′. (F) Representative flow cytometry analysis of adult WKM. (G) DsRed fluorescence of erythroid, lymphoid, precursor and myeloid fractions of WKM of βactin:Switch-DsRed (gray filled) and kdrl:Cre;βactin:Switch-DsRed (black line). (H) DsRed fluorescence of erythroid, lymphoid, precursor and myeloid fractions of WKM of UAS:Cre;βactin:Switch-DsRed (gray filled) and gata2b:Gal4;UAS:Cre;βactin:Switch-DsRed (black line). (I) Representative flow cytometry analysis of the adult spleen. (J) DsRed fluorescence of erythroid and lymphoid fractions of the spleen of βactin:Switch-DsRed (gray filled) and kdrl:Cre;βactin:Switch-DsRed (black line). (K) DsRed fluorescence of erythroid and lymphoid fractions of the spleen of UAS:Cre;βactin:Switch-DsRed (gray filled) and gata2b:Gal4;UAS:Cre;βactin:Switch-DsRed (black line). (G,H,J,K) Numbers indicate percentage of cells in the DsRed+ fraction.
Fig. 5.
Fig. 5.
gata2b is required for the formation of HSCs. (A-J) WISH of the indicated genes in wild-type embryos and gata2b morphant siblings at the stages indicated. (A′,B′,C′,D′,G′,H′,I′,J′) Magnified views of the trunk region. (E′,F′) Magnified views of the thymus region (dashed ovals) of E,F. The number of embryos showing the illustrated phenotype among the total examined is indicated. Scale bars: 250 µm.
Fig. 6.
Fig. 6.
Notch and non-canonical Wnt signaling contribute to gata2b expression in hemogenic endothelium. (A-D) WISH of runx1 and gata2b expression in control and mib morphant siblings. (E-H) Expression of runx1 and gata2b in embryos treated with DMSO or the γ-Secretase inhibitor DBZ from 10 to 24 hpf. (I-L) Expression of runx1 and gata2b in control and wnt16 morphant siblings. Scale bar: 250 µm.
Fig. 7.
Fig. 7.
notch1a and notch1b are required for expression of gata2b, but not gata2a, within the endothelium. (A-F) Expression of runx1 (A,B), gata2b (C,D) and gata2a (E,F) in control and notch1a morphant siblings. (G-L) Expression of runx1 (G,H), gata2b (I,J) and gata2a (K,L) in control and notch1b morphant siblings. Scale bars: 250 µm.

Similar articles

Cited by

References

    1. Auer T. O., Duroure K., De Cian A., Concordet J. P. and Del Bene F. (2014). Highly efficient CRISPR/Cas9-mediated knock-in in zebrafish by homology-independent DNA repair. Genome Res. 24, 142-153 10.1101/gr.161638 - DOI - PMC - PubMed
    1. Balla K. M., Lugo-Villarino G., Spitsbergen J. M., Stachura D. L., Hu Y., Banuelos K., Romo-Fewell O., Aroian R. V. and Traver D. (2010). Eosinophils in the zebrafish: prospective isolation, characterization, and eosinophilia induction by helminth determinants. Blood 116, 3944-3954 10.1182/blood-2010-03-267419 - DOI - PMC - PubMed
    1. Bee T., Ashley E. L. K., Bickley S. R. B., Jarratt A., Li P.-S., Sloane-Stanley J., Gottgens B. and de Bruijn M. F. T. R. (2009). The mouse Runx1+23 hematopoietic stem cell enhancer confers hematopoietic specificity to both Runx1 promoters. Blood 113, 5121-5124 10.1182/blood-2008-12-193003 - DOI - PubMed
    1. Bertrand J. Y., Kim A. D., Violette E. P., Stachura D. L., Cisson J. L. and Traver D. (2007). Definitive hematopoiesis initiates through a committed erythromyeloid progenitor in the zebrafish embryo. Development 134, 4147-4156 10.1242/dev.012385 - DOI - PMC - PubMed
    1. Bertrand J. Y., Kim A. D., Teng S. and Traver D. (2008). CD41+ cmyb+ precursors colonize the zebrafish pronephros by a novel migration route to initiate adult hematopoiesis. Development 135, 1853-1862 10.1242/dev.015297 - DOI - PMC - PubMed

Publication types

MeSH terms