. 2014 Dec;140(6):756-65.

Hypobaric hypoxia-mediated protein expression in plasma of susceptible & tolerant rats

Affiliations

Hypobaric hypoxia-mediated protein expression in plasma of susceptible & tolerant rats

Santosh Kumar et al. Indian J Med Res. 2014 Dec.

Abstract

Background & objectives: Low availability of oxygen at high altitudes has a great impact on the human life processes. There is a widespread interest and need to find out protein(s) that are possibly involved in mediating tolerance to hypobaric hypoxia. We undertook this study to identify and characterize protein expression in plasma of hypoxia susceptible and tolerant rats.

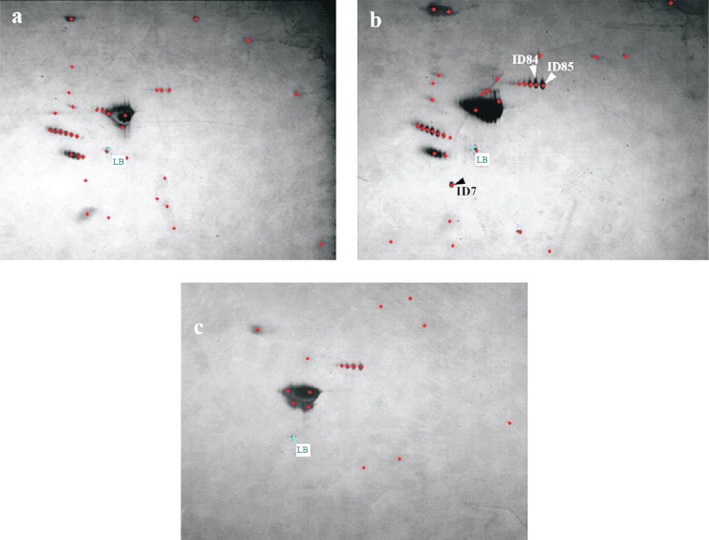
Methods: Male albino Sprague Dawley rats were segregated into susceptible and tolerant groups on the basis of their gasping time when exposed to simulated hypobaric hypoxia of 32,000 ft (9,754 m) at 32°C. Comparative proteome profiling of blood plasma of hypoxia susceptible and tolerant individuals was performed using 2-dimentional (2-D) gel electrophoresis.

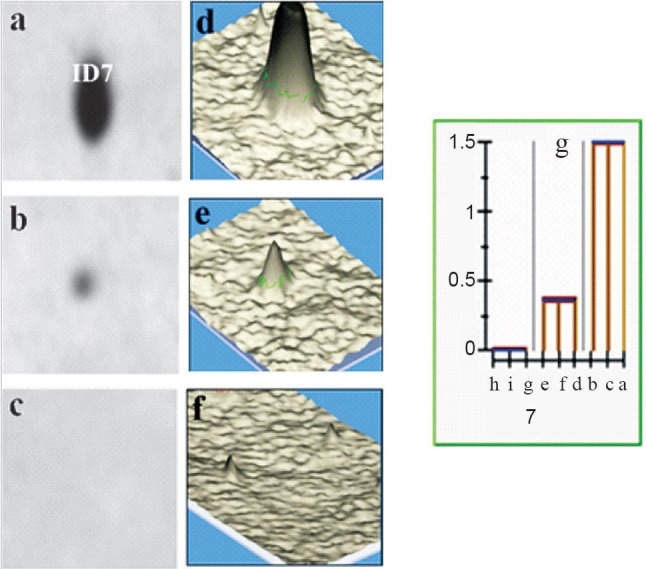
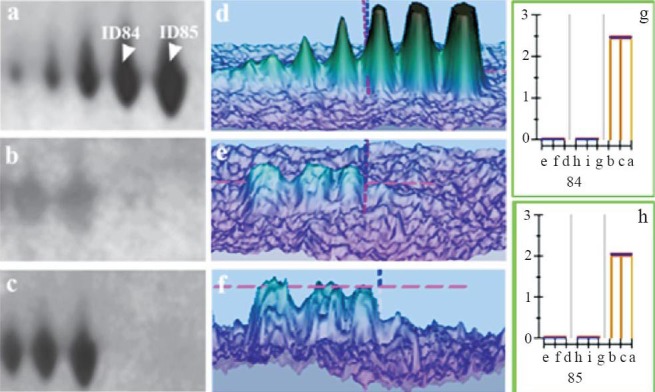
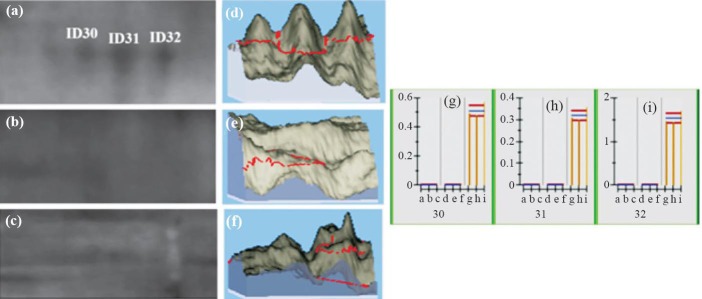
Results: Three proteins with higher expression levels were selected separately from tolerant and susceptible samples. Characterization of these proteins from tolerant sample using MALDI-TOF/TOF and MASCOT search indicated their homology with two different super-families viz. NADB-Rossmann superfamily (Rab GDP dissociation inhibitor β) and Transferrin superfamily (two Serotransferrins), having potential role in imparting tolerance against hypoxia. Three high level upregulated proteins were characterized from blood plasma of hypoxia susceptible animals showing similarity with threonine tRNA ligase (mitochondrial), carbohydrate sulphotransferase 7 and aspartate tRNA ligase (cytoplasmic) that play a role in ATP binding, carbohydrate metabolism and protein biosynthesis, respectively.

Interpretation & conclusions: Our results indicated that rats segregated into hypoxia sensitive and tolerant based on their gasping time showed differential expression of proteins in blood plasma. Characterization of these differentially expressed proteins will lead to better understanding of molecular responses occurring during hypoxia and subsequently development of biomarkers for categorization of hypoxia susceptible and tolerant individuals.


Figures

Fig. 1
Fig. 1
Silver stained 2-D gel of albumin and IgG depleted blood plasma samples of hypobaric hypoxia exposed Sprague Dawley rats showing the total detected protein spots (marked with red colour) and differentially expressed proteins (marked with arrow and protein spot ID); (a) susceptible; (b) tolerant and (c) normal.
Fig. 2
Fig. 2
Gel portion showing differential expression of spot ID7 of hypobaric hypoxia exposed Sprague Dawley rats; (a) tolerant: showing increased expression of protein spot ID7; (d) 3D peak representation of (a); (b) susceptible: showing low expression of spot ID7; (e) 3D peak representation of (b); (c) normal: showing absence of protein spot ID7; (f) 3D peak representation of (c); (g) histogram showing comparison of expression of protein spot ID7 in tolerant, susceptible and normal samples. X-axis represents samples (bar ‘bca’ represents tolerant; bar ‘efd’ represents susceptible; bar ‘hig’ represents normal) and Y-axis, corresponds to the relative spot intensity in arbitrary unit. 3D peak and histograms were generated using ImageMaster™ 2D Platinum 7.0 software. As per the user manual of ImageMaster™ 2D Platinum 7.0 software, in the histograms the vertical orange bars correspond to the spot values, the blue horizontal line represents the chosen central tendency and the red lines delimit the range defined by [Central value – Dispersion, Central value + Dispersion], and the match ID is displayed at the bottom of each histogram.
Fig. 3
Fig. 3
Gel portion showing differential expression of spot ID84 and ID85 of hypobaric hypoxia exposed Sprague Dawley rats; (a) tolerant: showing expression of protein spot ID84 and ID85; (d) 3D peak representation of (a); (b) susceptible: showing absence of protein spot ID84 and ID85; (e) 3D peak representation of (b); (c) normal: showing absence of spot ID84 and ID85; (f) 3D peak representation of (c); (g and h) histogram showing comparison of expression of protein spots with ID84 and ID85, respectively in tolerant, susceptible and normal samples. X-axis represents samples (bar ‘bca’ represents tolerant; bar ‘hig’ represents susceptible; bar ‘efd’ represents normal) and Y-axis, corresponds to the relative spot intensity in arbitrary unit. 3D peak and histograms were generated using ImageMaster™ 2D Platinum 7.0 software. As per the user manual of ImageMaster™ 2D Platinum 7.0 software, in the histograms the vertical orange bars correspond to the spot values, the blue horizontal line represents the chosen central tendency and the red lines delimit the range defined by [Central value – Dispersion, Central value + Dispersion], and the match ID is displayed at the bottom of each histogram.
Fig. 4
Fig. 4
Gel portion of samples fractionated on IPG strip pH 4-7, showing differential expression of protein spot ID30, ID31 and ID32 of hypobaric hypoxia exposed Sprague Dawley rats; (a) susceptible: showing expression of protein spot ID30, ID31 and ID32; (d) 3D peak representation of (a); (b) tolerant: indicating absence of protein spot ID30, ID31 and ID32; (e) 3D peak representation of (b); (c) normal: showing absence of protein spot ID30, ID31 and ID32; (f) 3D representation of (c); (g, h and i) histogram showing expression of protein spot ID30, ID31 and ID32, respectively in susceptible, tolerant and normal samples. X-axis represents samples (bar ‘ghi’ represents susceptible; bar ‘def’ represents tolerant; bar ‘abc’ represents normal). Y-axis, corresponds to the relative spot intensity in arbitrary unit. 3D peak and histograms were generated using ImageMaster™ 2D Platinum 7.0 software. As per the user manual of ImageMaster™ 2D Platinum 7.0 software, in the histograms the vertical orange bars correspond to the spot values, the blue horizontal line represents the chosen central tendency and the red lines delimit the range defined by [Central value – Dispersion, Central value + Dispersion], and the match ID is displayed at the bottom of each histogram.

Similar articles

Cited by

References

    1. Hackett PH, Roach RC. High altitude illness. New Engl J Med. 2001;345:107–14. - PubMed
    1. Kumar GK, Klein JB. Analysis of expression and post-translational modification of proteins during hypoxia. J Appl Physiol. 2004;96:1178–86. - PubMed
    1. Askew EW. Work at high altitude and oxidative stress: Antioxidant nutrients. Toxicology. 2002;180:107–19. - PubMed
    1. Peacock AJ. ABC of Oxygen: Oxygen at high altitude. BMJ. 1998;317:1063–6. - PMC - PubMed
    1. Yarnell PR, Heit J, Hackett PH. High-altitude cerebral edema (HACE): the Denver/ Front Range experience. Semin Neurol. 2000;20:209–17. - PubMed

Publication types