. 2015 Mar 9;27(3):327-41.
doi: 10.1016/j.ccell.2015.02.001.

Genomic analysis of smoothened inhibitor resistance in basal cell carcinoma

Affiliations

Genomic analysis of smoothened inhibitor resistance in basal cell carcinoma

Hayley J Sharpe et al. Cancer Cell. .

Abstract

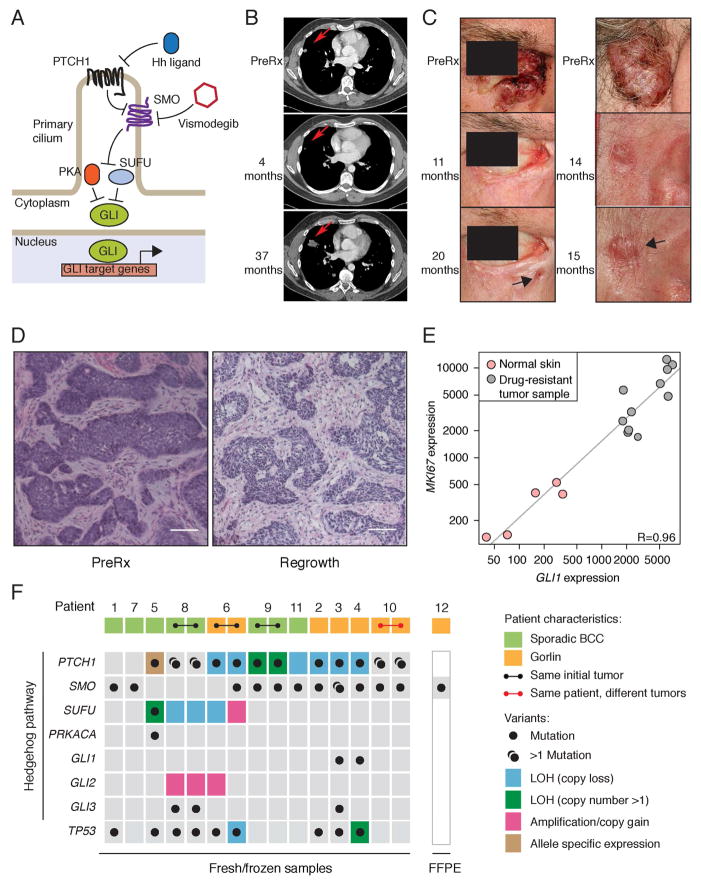
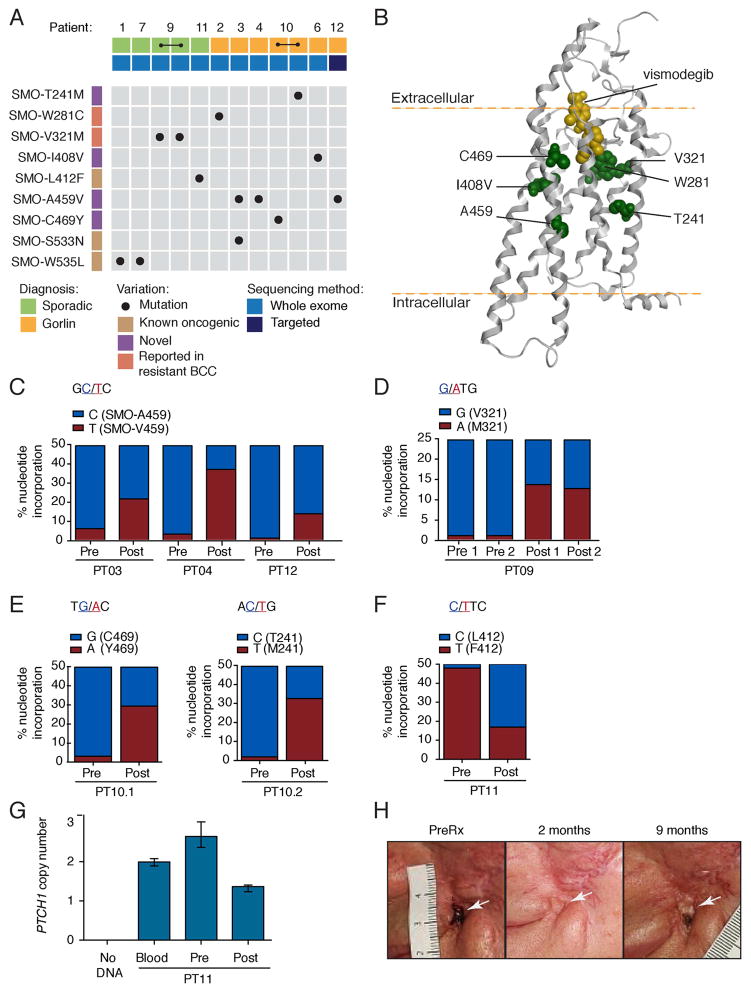
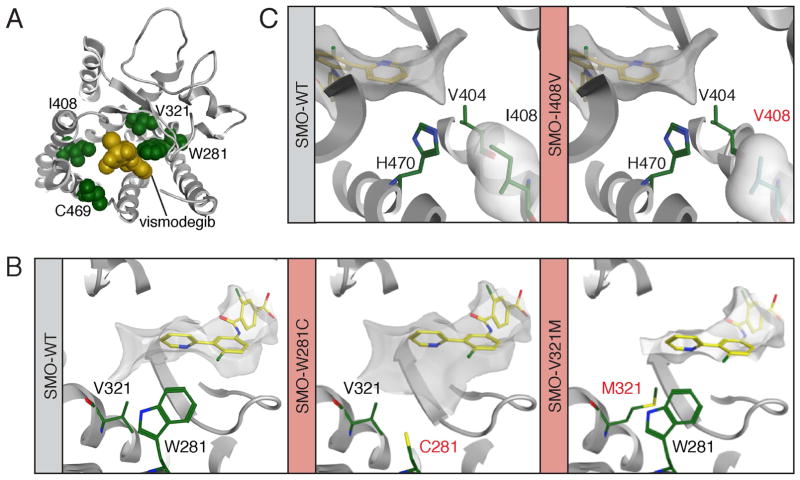
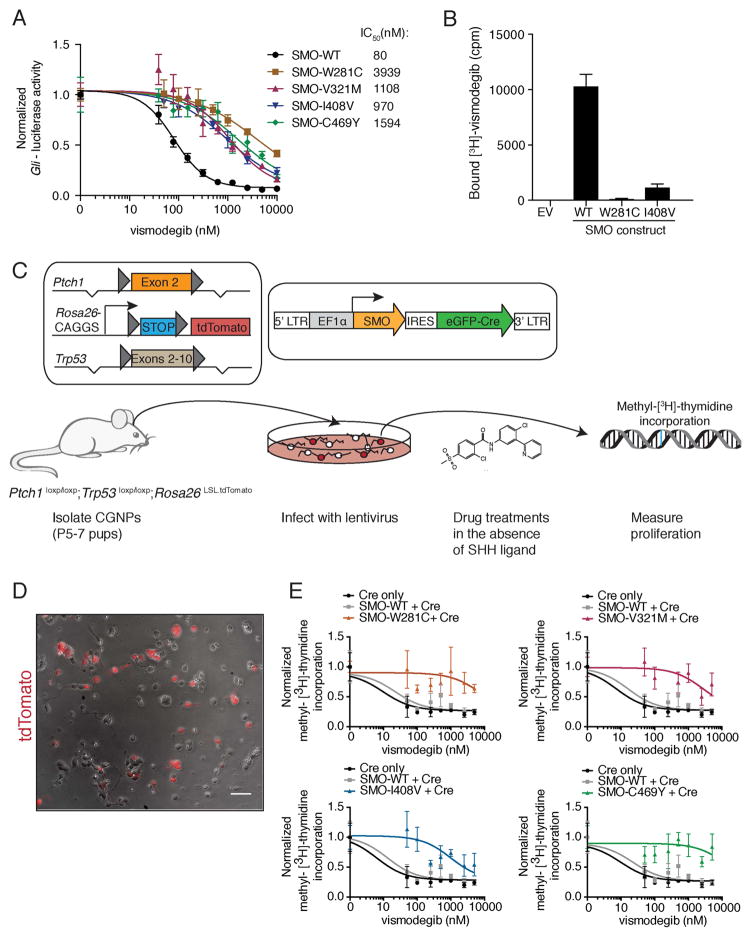
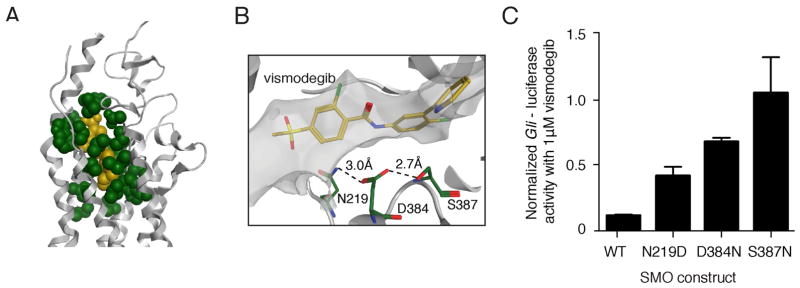
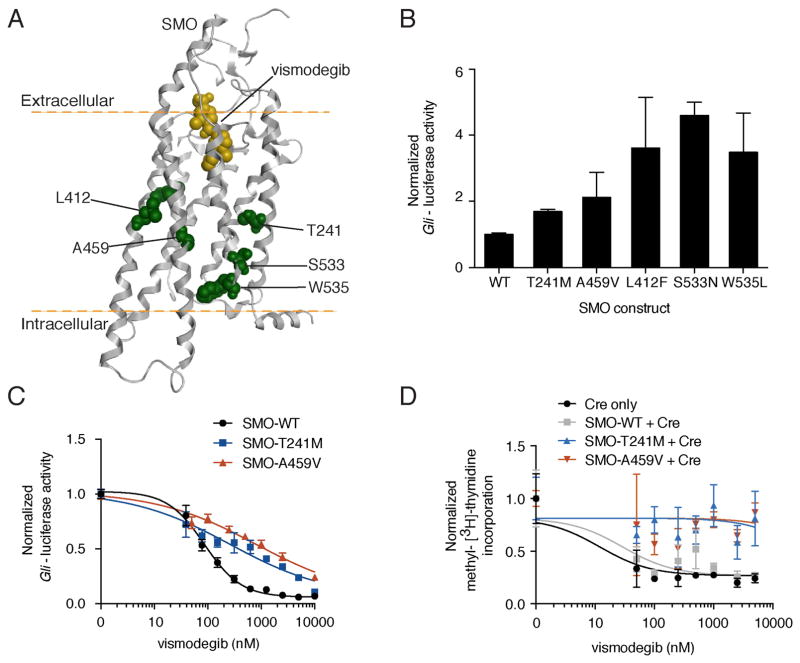
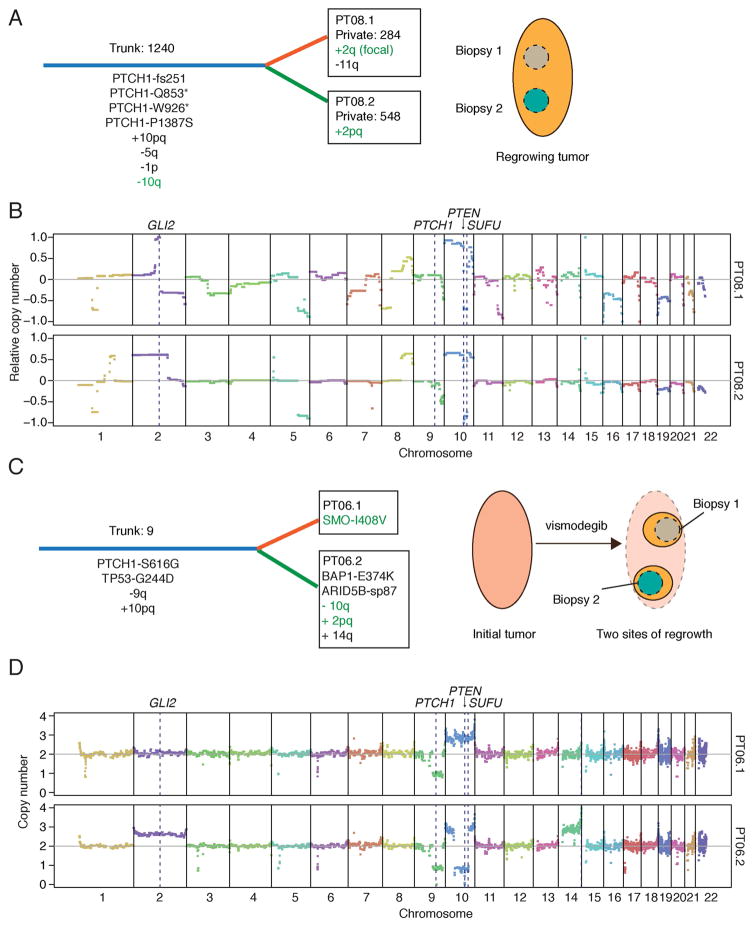
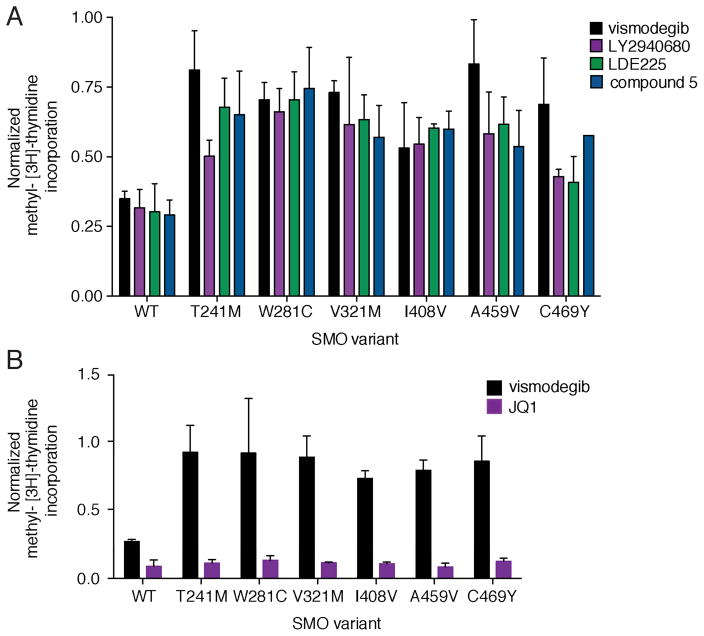
Smoothened (SMO) inhibitors are under clinical investigation for the treatment of several cancers. Vismodegib is approved for the treatment of locally advanced and metastatic basal cell carcinoma (BCC). Most BCC patients experience significant clinical benefit on vismodegib, but some develop resistance. Genomic analysis of tumor biopsies revealed that vismodegib resistance is associated with Hedgehog (Hh) pathway reactivation, predominantly through mutation of the drug target SMO and to a lesser extent through concurrent copy number changes in SUFU and GLI2. SMO mutations either directly impaired drug binding or activated SMO to varying levels. Furthermore, we found evidence for intra-tumor heterogeneity, suggesting that a combination of therapies targeting components at multiple levels of the Hh pathway is required to overcome resistance.


Figures

Figure 1
Figure 1. Genomic analysis of vismodegib-resistant BCC
(A) Schematic of the Hh pathway; see Introduction section in main text for details. (B) Initial response and disease progression of a sporadic BCC from PT12 that metastasized to lung. A red arrow indicates the target lesion in computerized tomography (CT) scans of the chest before treatment (PreRx) and after 4 (showing a decrease in lesion size) and 37 (revealing disease progression) months of vismodegib treatment. (C) Photographs of two locally advanced BCCs from Gorlin syndrome patient PT10 that initially responded to vismodegib but subsequently relapsed (black arrow) after the indicated length of treatment. (D) Hematoxylin and Eosin (H&E) stained sections of a locally advanced sporadic BCC from PT09.1 before and after 11 months of vismodegib treatment. Note that the relapsed lesion maintains the histology of the untreated tumor. The scale bar represents 50 μm. (E) GLI1 and MKI67 expression levels in vismodegib-resistant and normal skin biopsies. Pearson’s correlation coefficient (R) = 0.96. Normalized read counts are shown. (F) Overview of genetic alterations in Hh pathway genes and TP53 identified in 12 relapsed BCC patients. Germline PTCH1 variants are reported for Gorlin BCCs, whereas only somatic mutations are shown for sporadic BCCs. Two regionally distinct biopsies were obtained upon regrowth of the same initial tumor for PT06, PT08 and PT09. Two separate BCCs developed resistance in PT10. LOH was determined by minor allele frequencies from SNP arrays. Green boxes highlight LOH events followed by copy number gain of the mutant allele. Allele-specific expression was determined by RNA-seq. See also Figure S1 and Tables S1–S6.
Figure 2
Figure 2. SMO mutations in vismodegib-resistant BCC
(A) Overview of SMO mutations identified in this study. All mutations were somatic in nature, as they were not detected in either blood or other tissue from the same patient. (B) Computational model of vismodegib (yellow) docked onto the crystal structure of the SMO TM region (grey helices; Wang et al., 2013). Previously uncharacterized mutant residues are highlighted in green. (C–F) Prevalence of SMO mutations in pre- and post-treatment biopsies. Bar graphs show the incorporation frequency of either wild-type (blue) or mutant (red) nucleotides at positions corresponding to SMO-A459V for PT03, PT04 and PT12 (C), SMO-V321M for PT09 (D), SMO-C469Y and SMO-T241M for PT10 (E) and SMO-L412F for PT11 (F) as determined by pyrosequencing. Note that SMO mutations are expected to be heterozygous and that SMO copy number determines the maximum Y-axis value, which is 50% for PT03, PT04, PT12, PT10 and PT11 (SMO copy number is 2) and 25% for PT09 (SMO copy number is 4). Incorporation of mutant nucleotides was considered to be within the background levels (<5%) of the pyrosequencing assay in all pre-treatment samples. (G) PTCH1 copy number in pre- and post-treatment biopsies from PT11. Data plotted are mean and the range of quadruplicates. (H) Photographs of a locally advanced BCC (white arrow) from PT11 that initially responded to vismodegib, but subsequently relapsed after the indicated length of time. See also Figure S2 and Table S7.
Figure 3
Figure 3. Structure-function modeling of SMO drug-binding pocket mutants
(A) Computational docking model showing a top down view of vismodegib (yellow) binding to SMO (grey) and revealing the proximity of W281, V321, I408 and C469 (all green) to the drug-binding pocket. (B) Left: The position of V321 and W281 (both green) relative to vismodegib (yellow). Middle: The C281 mutant from PT02. Right: The M321 mutant from PT09 is expected to impact the conformation of W281. (C) Positioning of I408 (left) and the mutant V408 (right) relative to vismodegib. In all panels mutant residues are highlighted in red text.
Figure 4
Figure 4. Functional analyses of SMO drug-binding pocket mutants
(A) Normalized Gli-luciferase reporter activity in C3H10T½ cells transfected with constructs expressing indicated SMO variants, following a dose response with vismodegib. Values were normalized to untreated activity and data plotted are mean +/− standard deviation (SD) of triplicates. IC50 values were calculated after non-linear regression fitting. (B) Binding of [3H]-vismodegib to HEK-293 cells transfected with constructs expressing indicated SMO variants. EV stands for empty vector and drug binding was measured in counts per minute (cpm). Specific binding was calculated after competition with an excess of unlabeled vismodegib by subtracting non-specific binding from total binding. Data shown are the mean +/− SD. (C) Viral transduction scheme of primary CGNPs. Only transduced CGNPs proliferate in the absence of SHH, allowing us to specifically test the ability of our SMO variants to promote proliferation in the presence of vismodegib. (D) Overlay of a representative bright field and red fluorescent image from a PPT CGNP culture after infection with a Cre-expressing lentivirus. The scale bar represents 50 μm. (E) Normalized methyl-[3H]-thymidine incorporation of PPT CGNPs transduced with indicated viruses, following a dose response with vismodegib after removal of SHH ligand. Each graph shows the same control data. Data plotted are mean +/− SD of triplicates. See also Figure S3.
Figure 5
Figure 5. Predicting resistance by mutation of the SMO drug-binding pocket
(A) Illustration of the 21 residues (green) predicted to have atoms within 4.5Å of vismodegib (yellow) bound to the SMO TM structure (grey helices). (B) Illustration of a hydrogen-bonding network (dashed lines) formed by N219, D384 and S387. Mutation of any of these residues is likely to change the shape of the vismodegib-binding pocket. (C) Gli-luciferase reporter activity in C3H10T½ cells transfected with indicated SMO- expressing constructs and treated with 1 μM vismodegib. Values were normalized to untreated activity levels for each construct and data plotted are mean +/− SD of triplicates. See also Table S8.
Figure 6
Figure 6. Characterization of SMO mutants outside the drug-binding pocket
(A) Computational model of vismodegib (yellow) docked onto the crystal structure of the SMO TM region (grey helices; Wang et al., 2013). Mutant residues distal to the drug-binding pocket are highlighted in green. (B) Gli-luciferase reporter activity in C3H10T½ cells transfected with indicated SMO-expressing constructs. Values were normalized to activity levels of SMO-WT and data plotted are mean +/− SD of triplicates. (C) Normalized Gli-luciferase reporter activity in C3H10T½ cells transfected with indicated SMO-expressing constructs, following a dose response with vismodegib. Data plotted are mean +/− SD of triplicates. (D) Normalized methyl-[3H]-thymidine incorporation of PPT CGNPs transduced with indicated viruses, following a dose response with vismodegib after removal of SHH ligand. Data plotted are mean +/− SD of triplicates. See also Figure S4.
Figure 7
Figure 7. Intra-tumor heterogeneity and downstream resistance mechanisms
(A) Schematic depicting genetic heterogeneity between two biopsies from PT08. Common (Trunk; blue) and unique (Private; orange or green) genetic events are shown with their respective number of somatic mutations. Putative resistance mechanisms are highlighted in green text. Cartoon on right shows spatially separated biopsy sites from the same progressing lesion. (B) CNV plots for PT08.1 and PT08.2 highlighting key genes that likely contributed to tumor initiation and vismodegib resistance. Copy numbers were derived from array CGH and are shown relative to control tissue. (C) Schematic depicting genetic heterogeneity between two biopsies from PT06 (same labeling scheme as in (A)). Mutational analysis of a pre-defined list of cancer-associated genes was used to compare the two sites, as germline calls were not available. Cartoon on right shows two separate sites of regrowth from the same regressed lesion. (D) CNV plots for PT06.1 and PT06.2 highlighting key genes that likely contributed to tumor initiation and vismodegib resistance. Absolute copy number values were derived from SNP arrays. See also Figure S5.
Figure 8
Figure 8. Therapeutic options for vismodegib resistant BCC
(A) Normalized methyl-[3H]-thymidine incorporation of PPT CGNPs transduced with various SMO variants and treated with 500 nM of indicated compounds. Values were normalized to proliferation levels without drug and data plotted are mean +/− SD of triplicates. Note that the residual proliferation of SMO-WT in the presence of drug is due to fibroblast and glial contamination of these primary CGNP cultures. (B) Same as in (A), but transduced CGNPs were treated with 1 μM of either vismodegib or JQ1.

Comment in

References

    1. Amakye D, Jagani Z, Dorsch M. Unraveling the therapeutic potential of the Hedgehog pathway in cancer. Nature medicine. 2013;19:1410–1422. - PubMed
    1. Atwood SX, Li M, Lee A, Tang JY, Oro AE. GLI activation by atypical protein kinase C iota/lambda regulates the growth of basal cell carcinomas. Nature. 2013;494:484–488. - PMC - PubMed
    1. Brastianos PK, Horowitz PM, Santagata S, Jones RT, McKenna A, Getz G, Ligon KL, Palescandolo E, Van Hummelen P, Ducar MD, et al. Genomic sequencing of meningiomas identifies oncogenic SMO and AKT1 mutations. Nature genetics. 2013;45:285–289. - PMC - PubMed
    1. Brinkhuizen T, Reinders MG, van Geel M, Hendriksen AJ, Paulussen AD, Winnepenninckx VJ, Keymeulen KB, Soetekouw PM, van Steensel MA, Mosterd K. Acquired resistance to the Hedgehog pathway inhibitor vismodegib due to smoothened mutations in treatment of locally advanced basal cell carcinoma. Journal of the American Academy of Dermatology 2014 - PubMed
    1. Buonamici S, Williams J, Morrissey M, Wang A, Guo R, Vattay A, Hsiao K, Yuan J, Green J, Ospina B, et al. Interfering with resistance to smoothened antagonists by inhibition of the PI3K pathway in medulloblastoma. Sci Transl Med. 2010;2:51ra70. - PMC - PubMed

MeSH terms