

Lysyl oxidase-like 2 represses Notch1 expression in the skin to promote squamous cell carcinoma progression
- PMID: 25759215
- PMCID: PMC4406654
- DOI: 10.15252/embj.201489975
Lysyl oxidase-like 2 represses Notch1 expression in the skin to promote squamous cell carcinoma progression
Abstract
Lysyl oxidase-like 2 (LOXL2) is involved in a wide range of physiological and pathological processes, including fibrosis and tumor progression, implicating intracellular and extracellular functions. To explore the specific in vivo role of LOXL2 in physiological and tumor contexts, we generated conditional gain- and loss-of-function mouse models. Germ-line deletion of Loxl2 promotes lethality in half of newborn mice mainly associated to congenital heart defects, while Loxl2 overexpression triggers male sterility due to epididymal dysfunction caused by epithelial disorganization, fibrosis and acute inflammation. Remarkably, when challenged to chemical skin carcinogenesis, Loxl2-overexpressing mice increased tumor burden and malignant progression, while Loxl2-deficient mice exhibit the opposite phenotypes. Loxl2 levels in premalignant tumors negatively correlate with expression of epidermal differentiation markers and components of the Notch1 pathway. We show that LOXL2 is a direct repressor of NOTCH1. Additionally, we identify an exclusive expression pattern between LOXL2 and members of the canonical NOTCH1 pathway in human HNSCC. Our data identify for the first time novel LOXL2 roles in tissue homeostasis and support it as a target for SCC therapy.
Keywords: Loxl2 mouse models; Notch1; epidermal differentiation; male sterility; squamous cell carcinoma.
© 2015 The Authors.
Figures
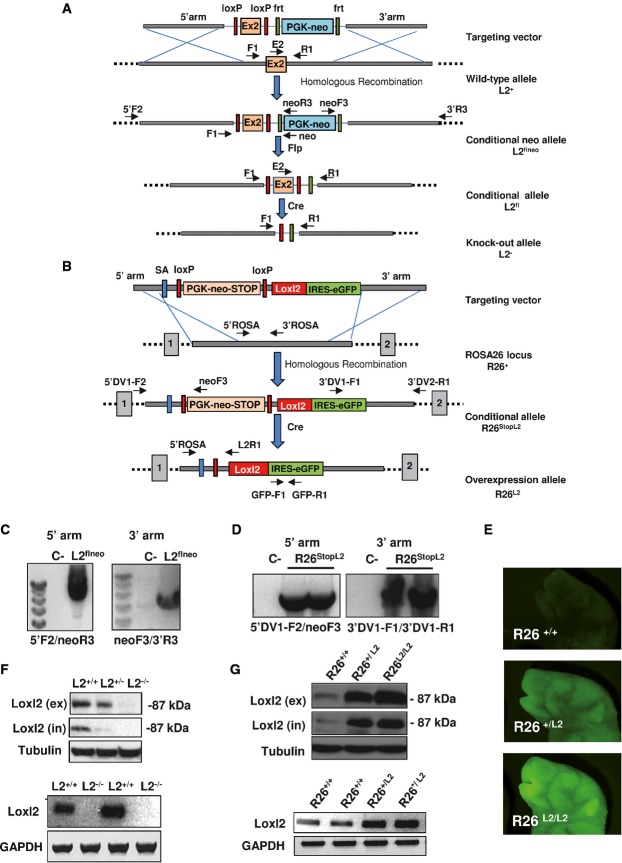
A Schematic representation of different Loxl2-targeted alleles. Exon 2 (orange box) and PGK-neomycin selection marker (blue box) flanked by LoxP (red rectangles) and frt (green rectangles) sites, respectively, are indicated in the targeting vector. Homologous recombination resulted in the generation of L2flneo allele and subsequent recombination events mediated by Flp (flippase) and Cre enzymes yielded L2fl and L2− alleles, respectively. Position of primers used in PCRs is indicated.
B Schematic representation of different ROSA26 allele variants used in the study. Targeting vector containing PGK-neomycin-stop cassette (orange box) flanked by LoxP sites (red rectangles), splicing acceptor signal (SA) (blue rectangle) and Loxl2 cDNA sequence (red box) followed by the IRES-GFP reporter gene (green box), are represented. R26StopL2 allele is initially generated by homologous recombination. After Cre-mediated excision, the PGK-neomycin-stop element is removed and the Loxl2/GFP tandem is expressed under the control of ROSA26 promoter (R26L2 allele). Primer pairs for PCR analysis are also detailed.
C,D Diagnostic PCR analysis of positive ES cell clones showing the detection of the recombinant L2flne (C) and R26StopL2 (D) alleles. Negative controls were also used in parallel (C-).
E GFP images from wild-type, heterozygous and homozygous Loxl2-overexpressing newborn mice.
F,G Western blot analysis (upper panels) of whole-cell extracts (in) and conditioned medium (ex), and semi-quantitative PCR (lower panels) performed in MEFs from the indicated genotypes. α-tubulin and GAPDH were used as loading controls in Western blot analysis and semi-quantitative PCR, respectively.
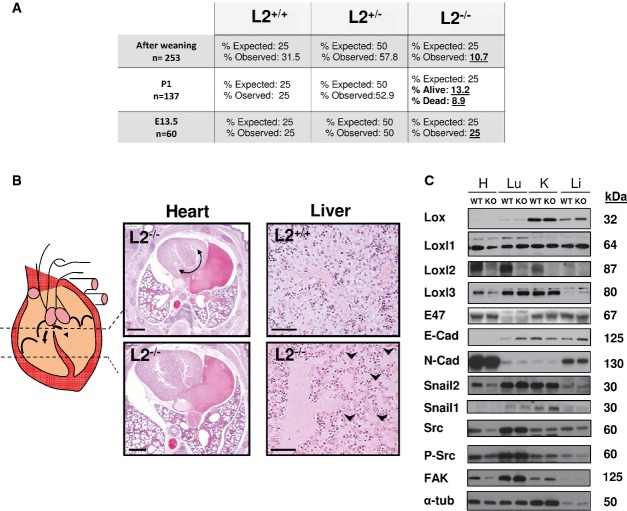
Percentage of observed surviving animals compared to the expected Mendelian ratio in wild-type, heterozygous and knock-out animals at mid-gestation (E13.5), P1 and after weaning. Mendelian values reflecting perinatal lethality are in bold.
Diagram and H&E of transversal sections from Loxl2 KO heart at different levels showing aberrant ventricular communication (left). Curved arrow points to disrupted ventricular septa. H&E sections of livers (right) from Loxl2 WT (top) and KO (bottom) neonates. Arrowheads indicate regions of capillary distension. Scale bars: 1,500 μm (heart), 100 μm (liver).
Western blot analysis of Lox members, EMT markers and Src/FAK pathway in the indicated tissues derived from a pool of two P1 neonates of each Loxl2 genotype. H, heart; Lu, lung; K, kidney and L, liver. Molecular mass of each marker is shown on the right. Notice that the 4 right lanes corresponding to Lox and Loxl3 markers were rotated 180°C from the original blots because of a mistake in the loading order of kidney and liver samples. Original blots for Lox, Loxl1, Loxl2 and Loxl3 detection are shown in the source data for this figure.
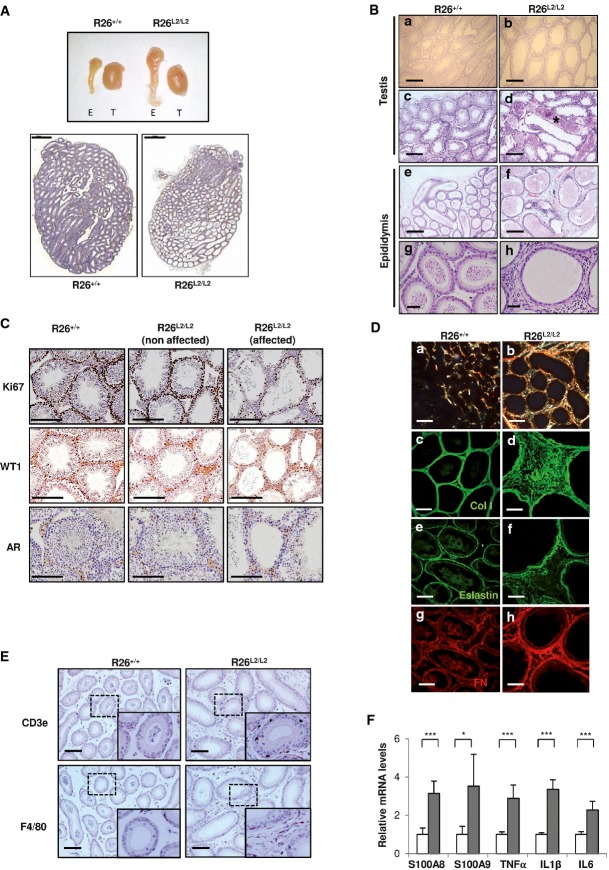
Macroscopic view of testis and epididymis from R26+/+ and R26L2/L2 mice (top) and H&E image of whole testis from both groups of animals showing testicular degeneration in the overexpressing mice (bottom). T: testis, E: epididymis. Scale bar in lower panels: 1,000 μm.
H&E from paraffin-embedded tissues of testis (upper panels) and epididymis (lower panels) from R26+/+ and R26L2/L2 mice showing testicular degeneration (a, b), spermatocele formation (asterisk) (c, d), abnormal epididymal architecture (e, f) and complete absence of spermatozoa in testis (g, h) from R26L2/L2 mice of 4 months of age in comparison with their respective controls. Scale bars: 250 μm (a–f) and 50 μm (g, h).
Immunohistochemical analysis of testis derived from 3-month-old mutant and control animals for Ki67, WT1 and androgen receptor (AR) markers to evaluate proliferation, Sertoli and Leydig cell populations, respectively. Affected and non-affected testis region from R26L2/L2 mice (middle and right panels) compared to control R26+/+ testis (left panels) are shown. Scale bar: 250 μm.
Picrosirius red staining images of epididymis from control and R26L2/L2 mice of 3 months of age under polarized light (a, b). Confocal immunofluorescence images for collagen I (Col I) (c, d), elastin (e, f) and fibronectin (FN) (g, h) in OCT sections of epididymis from 3-month-old control R26+/+ and R26L2/L2 mice. Scale bars: 250 μm (a, b) and 100 μm (c–h).
Immunohistochemical analysis for inflammatory cell markers CD3e (T-lymphocytes) (top) and F4/80 (macrophages) (bottom) in epididymis from R26+/+ and R26L2/L2 mice of 3 months of age. Scale bars: 100 μm. Inserts show a 2.5-fold amplified region.
Quantitative RT–PCR of S100A8, S100A9, TNFα, IL1β and IL6 cytokine expression in epididymis from R26+/+ (white) and R26L2/L2 (gray) mice. *P < 0.05; ***P < 0.001 (Student's t-test; unpaired, 2-tailed). Error bars represent standard error.
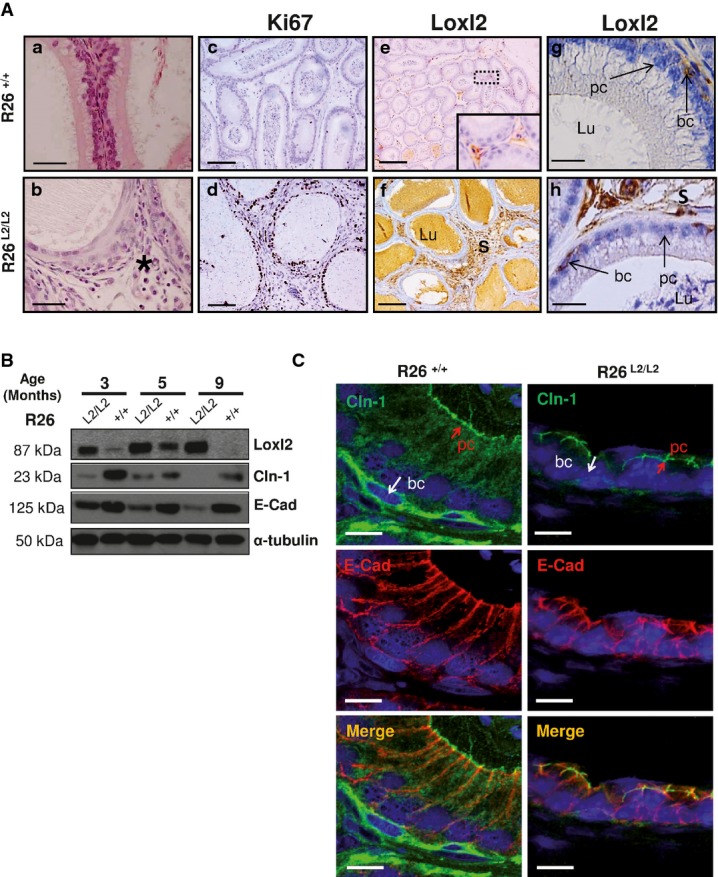
Detailed region of squamous cell metaplasia in epididymis from Loxl2-overexpressing mice (b, black asterisk) compared to the normal epididymal architecture found in control counterparts (a). Immunohistochemical analysis shows increased Ki67 staining in stroma and epithelium components of R26L2/L2 epididymal tissue (d) compared to controls (c). Immunohistochemical staining of Loxl2 in epididymis from control (e, g) and R26L2/L2 mice (f, h) showing Loxl2 overexpression in both surrounding stroma (f) and basal cells (h) of R26L2/L2 in comparison with basal levels detected in R26+/+ mice (e, g). Insert in (e) shows a fourfold amplified region. Arrows in (g, h) indicate Loxl2 expression in basal cells. Scale bars: 50 μm (a, b), 100 μm (c, d), 250 μm (e, f) and 25 μm (g, h).
Western blot analysis of Loxl2, E-cadherin (E-cad) and claudin-1 (Cdn-1) protein levels in epididymal extracts from mice of the indicated Loxl2 genotypes and age. Two independent experiments with 2 different animals per genotype and age were performed.
Immunofluorescence analysis of E-cadherin and claudin-1 in OCT sections from epididymis of control and 3-month-old R26L2/L2 mice. Merged images are shown in the bottom panels. Scale bar: 10 μm.
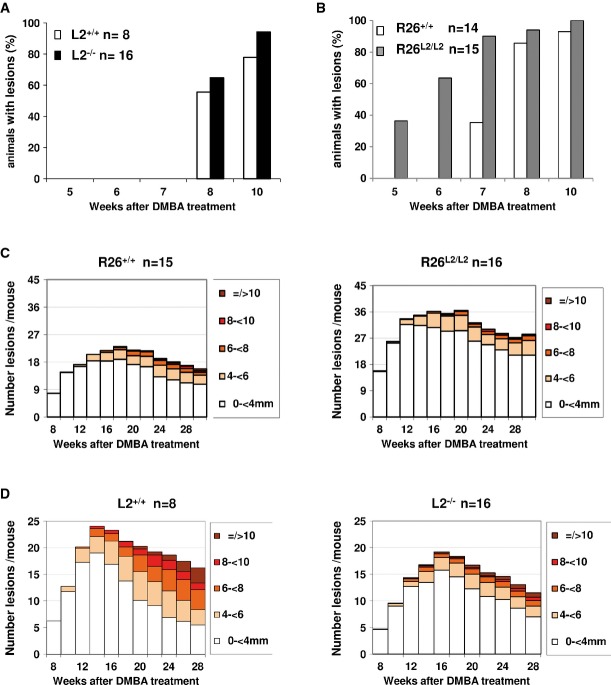
A,B The onset of lesion formation after DMBA-TPA treatment is indicated as the percentage of (A) L2+/+ and L2−/− and (B) R26+/+ and R26L2/L2 mice with tumors from 5 to 10 weeks post-initiation.
C,D Number and size of lesions per mouse are shown from (C) 8 to 30 weeks post-DMBA application in R26+/+ (left) and R26L2/L2 (right) mice, and from (D) 8 to 28 weeks post-DMBA application in L2+/+ (left) and L2−/− (right) mice. n: number of mice used in each experimental group. Statistical analysis is provided in Supplementary Fig S2.
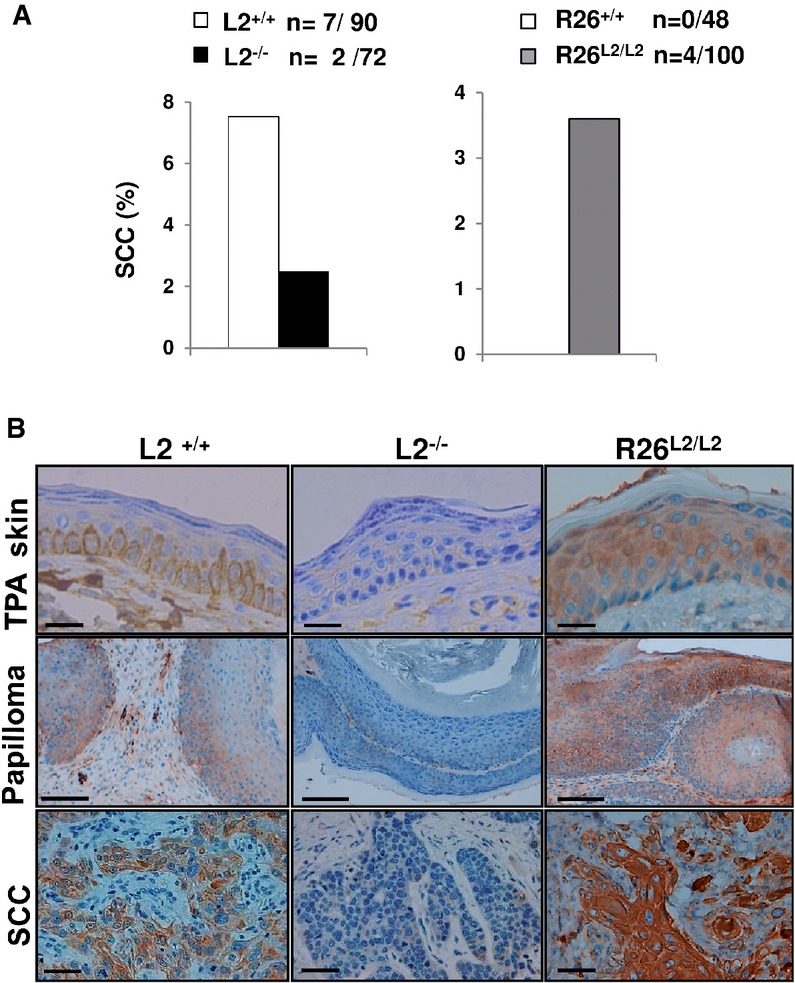
Percentage of squamous cell carcinomas (SSC) per mouse observed in L2−/− (left, black bars) and R26L2/L2 (right, gray bars) mutant mice compared to their respective controls (white bars); n: absolute number of SCC regarding total number of analyzed lesions per each Loxl2 genotype.
Immunohistochemical staining for Loxl2 in TPA-treated skins, papillomas and SCC from control L2+/+, L2−/− and overexpressing R26L2/L2 mice. Scale bars: 100 μm (top and bottom panels) and 250 μm (central panels). Immunohistochemical images are representative of three analyzed animals per genotype.
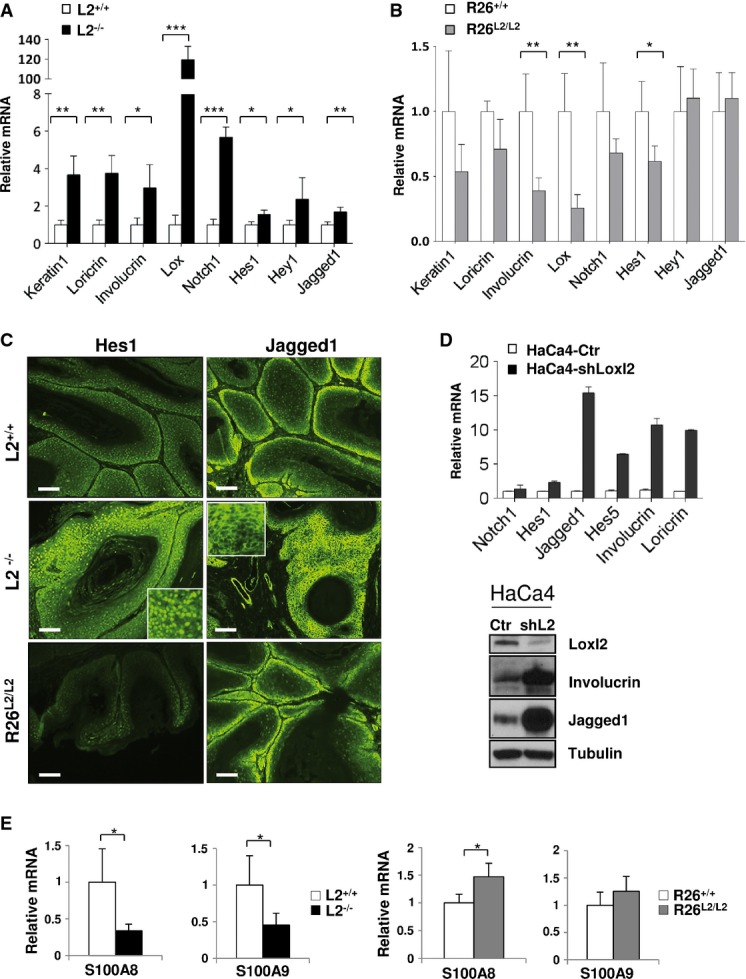
Quantitative RT–PCR analysis of epidermal differentiation markers (keratin-1, loricrin, involucrin and Lox) and Notch1 pathway-related genes (Notch1, Hes1, Hey1 and Jagged1) in papillomas from control and L2−/− mice.
The same quantitative RT–PCR analysis as in (A) was carried out in papillomas from control and R26L2/L2 mice.
Representative immunofluorescence staining for Hes1 (left panels) and Jagged1 (right panels) in papillomas of the indicated Loxl2 genotypes. Sixteen lesions from four different mice of each genotype were examined. Scale bars: 250 μm. Inserts in central panels show representative threefold amplified regions.
Quantitative RT–PCR (top) and Western blot analysis (bottom) of differentiation markers and Notch1-related genes in control (HaCa4-Ctr) and Loxl2-interfered (HaCa4-shLoxl2) HaCa4 cells. Detection of Loxl2 levels is shown as a control of the knockdown efficiency. Two experimental replicates were carried out.
Quantitative RT–PCR analyses of S100A8 and S100A9 expression in papillomas from L2−/− (left) and R26L2/L2 mice (right) compared to their respective controls.
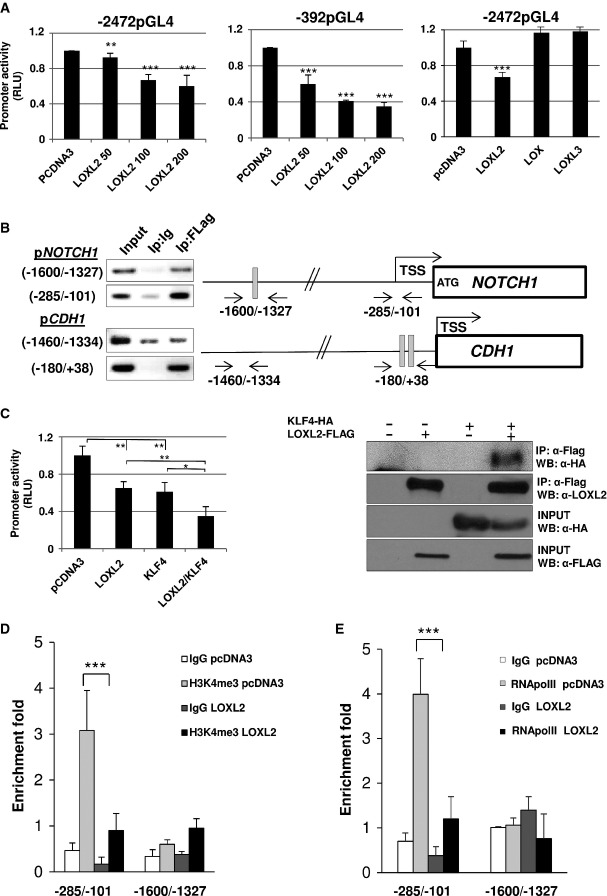
A NOTCH1 promoter activity assays performed in HEK293T cells using full-length (−2472pGL4; left panel) and minimal functional (−392pGL4; middle panel) promoter regions in the presence of pcDNA3 control (200 ng) and increasing amounts of human LOXL2. NOTCH1 promoter activity was also measured using −2472pGL4 promoter region (right panel) in the presence of human LOX and LOXL3 (100 ng). Results are the average of at least three different experiments performed on triplicate samples.
B Chromatin immunoprecipitation (ChIP) assays in HEK293T cells transiently expressing LOXL2-Flag for binding to endogenous NOTCH1 (upper panels) and E-cadherin (CDH1) (lower panels) promoters in distal and proximal regions. Negative control with rabbit IgG (Ip: Ig) and positive input non-immunoprecipitated fractions are included. Positions of primers for amplification and E-boxes (gray) in both promoters are indicated. Transcription start site (TSS) for both genes and ATG initiating codon in NOTCH1 are also represented (Lambertini et al, 2010). Results show one representative experiment out of three performed for each condition and gene.
C Left: NOTCH1 promoter activity assays performed in HEK293T cells using −392pGL4 promoter region in the presence of pcDNA3 control (200 ng), human LOXL2 or KLF4 (100 ng pcDNA3 + 100 ng plasmid of interest), and combined expression of LOXL2 and KLF4 (100 ng of each). Results show the average of three different experiments performed on triplicate samples. Right: coimmunoprecipitation assays in HEK293T cells transiently transfected with KLF4-HA and LOXL2-FLAG. Cell extracts were immunoprecipitated with anti-FLAG and analyzed with anti-HA for detecting interaction between LOXL2 and KLF4 (upper panel). As a positive control of immunoprecipitation, membranes were also incubated with specific LOXL2 antibody (middle upper panel). Lower panels show input levels of the indicated proteins.
D,E ChIP assay for the detection of endogenous H3K4me3 levels (D) and binding of RNA polymerase II (E) in the indicated regions of the NOTCH1 promoter in HEK293T cells transiently expressing LOXL2 or pcDNA3 as a control. All ChIP samples were examined in parallel by PCR amplification of a negative control region (see Supplementary Table S4). Results are expressed as fold enrichment for each indicated binding site relative to the negative control region. The average of two experimental triplicates is shown.
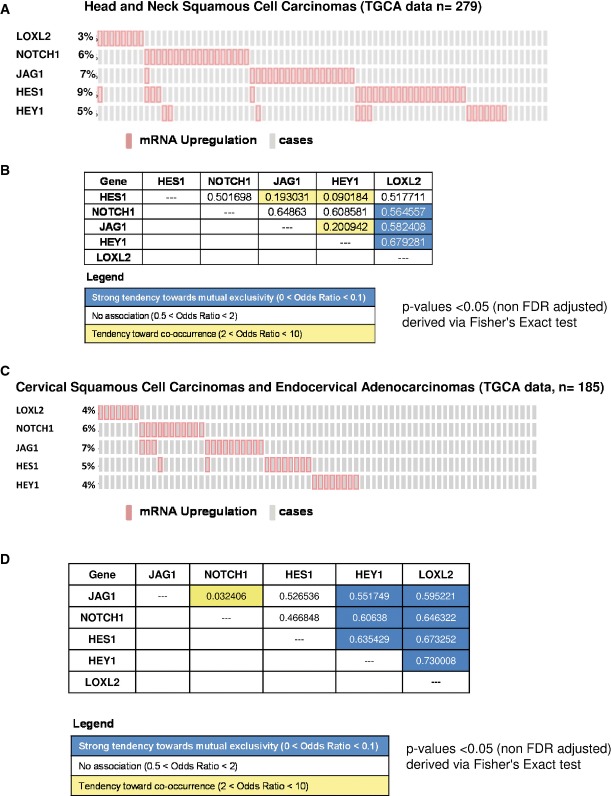
A–D Meta-study of 279 head and neck carcinomas (A) and 185 cervical squamous cell carcinomas and endocervical adenocarcinomas (C) from TCGA (
http://www.cbioportal.org/public-portal/index.do ) to analyze the percentage of samples with altered expression of LOXL2, NOTCH1, JAG1, HEY1 and HES1 (ref: pink, cases with overexpression of the indicated genes; gray, individual cases). The representation only includes the cases with alteration in at least one of the indicated genes. (B, D) Mutual exclusivity study among genes indicated in (A, B). The P-values shown in the tables were calculated using a Fisher test in a BioCarta tool (http://www.cbioportal.org/public-portal/index.do ). For this analysis, we selected a z-score threshold of 2.0. The legend (lower) represents the level of tendency to occur.
References
-
- Barker HE, Cox TR, Erler JT. The rationale for targeting the LOX family in cancer. Nat Rev Cancer. 2012;12:540–552. - PubMed
-
- Barry-Hamilton V, Spangler R, Marshall D, McCauley S, Rodriguez HM, Oyasu M, Mikels A, Vaysberg M, Ghermazien H, Wai C, Garcia CA, Velayo AC, Jorgensen B, Biermann D, Tsai D, Green J, Zaffryar-Eilot S, Holzer A, Ogg S, Thai D, et al. Allosteric inhibition of lysyl oxidase-like-2 impedes the development of a pathologic microenvironment. Nat Med. 2010;16:1009–1017. - PubMed
-
- Bignon M, Pichol-Thievend C, Hardouin J, Malbouyres M, Brechot N, Nasciutti L, Barret A, Teillon J, Guillon E, Etienne E, Caron M, Joubert-Caron R, Monnot C, Ruggiero F, Muller L, Germain S. Lysyl oxidase-like protein-2 regulates sprouting angiogenesis and type IV collagen assembly in the endothelial basement membrane. Blood. 2011;118:3979–3989. - PubMed
Publication types
MeSH terms
Substances
Grants and funding
LinkOut - more resources
Full Text Sources
Other Literature Sources
Medical
Molecular Biology Databases
Research Materials
