

Snai1 regulates cell lineage allocation and stem cell maintenance in the mouse intestinal epithelium
- PMID: 25759216
- PMCID: PMC4491994
- DOI: 10.15252/embj.201490881
Snai1 regulates cell lineage allocation and stem cell maintenance in the mouse intestinal epithelium
Abstract
Snail family members regulate epithelial-to-mesenchymal transition (EMT) during invasion of intestinal tumours, but their role in normal intestinal homeostasis is unknown. Studies in breast and skin epithelia indicate that Snail proteins promote an undifferentiated state. Here, we demonstrate that conditional knockout of Snai1 in the intestinal epithelium results in apoptotic loss of crypt base columnar stem cells and bias towards differentiation of secretory lineages. In vitro organoid cultures derived from Snai1 conditional knockout mice also undergo apoptosis when Snai1 is deleted. Conversely, ectopic expression of Snai1 in the intestinal epithelium in vivo results in the expansion of the crypt base columnar cell pool and a decrease in secretory enteroendocrine and Paneth cells. Following conditional deletion of Snai1, the intestinal epithelium fails to produce a proliferative response following radiation-induced damage indicating a fundamental requirement for Snai1 in epithelial regeneration. These results demonstrate that Snai1 is required for regulation of lineage choice, maintenance of CBC stem cells and regeneration of the intestinal epithelium following damage.
Keywords: SerinC3; Snail; apoptosis; intestinal stem cell; organoid.
© 2015 The Authors.
Figures
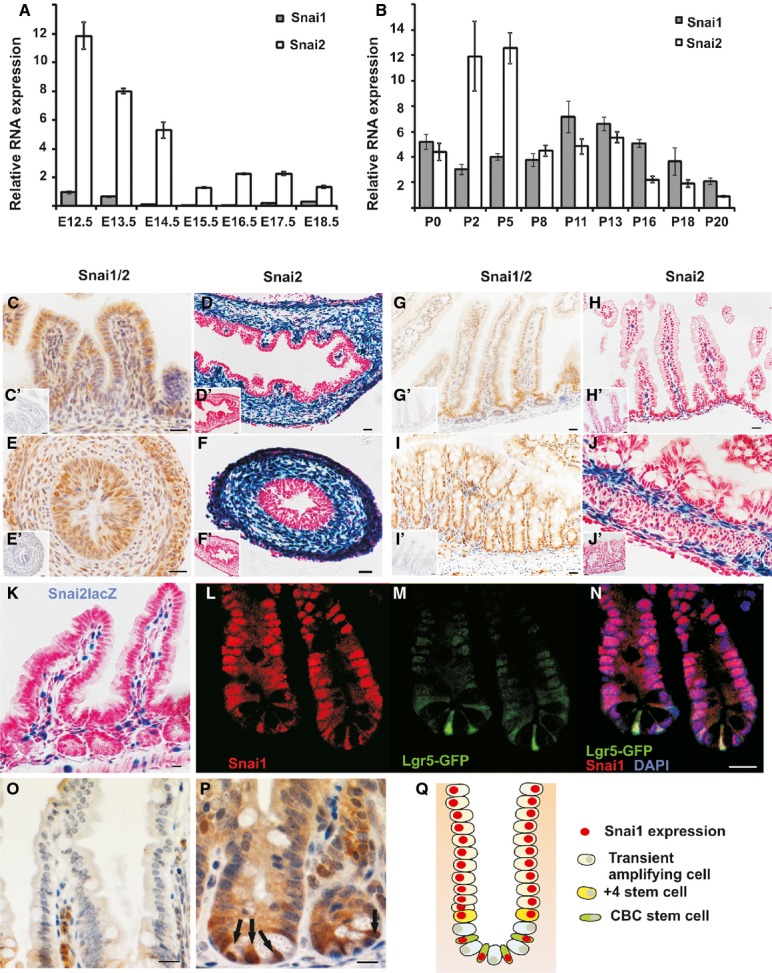
A, B Temporal expression of Snail genes in the intestinal tract in (A) embryonic E12.5 to E18.5 and (B) postnatal P0 to P20 measured by qRT–PCR. Shown are means ± SD.
C, E, G, I Immunohistochemical staining for Snai1/2 (Abcam ab85931) (C) E14.5 midgut, (E) E14.5 hind gut, (G) postnatal day 14 SI, (I) postnatal day 14 colon. Snai1 immunohistochemistry peptide competition controls are shown as inserts (C’, E’, G’, I’). Scale bars: 20 mm.
D, F, H, J, K X-gal staining for β-galactosidase activity in tissue from Snai2LacZ mice stained in whole mount, sectioned and counterstained with nuclear fast red (D) E14.5 midgut, (F) E14.5 hind gut, (H) postnatal day 14 SI, (J) postnatal day 14 colon, (K) adult SI. Controls for X-gal staining are shown as inserts (D’, F’, H’, J’).
L, M, N Double immunostaining of small intestinal crypts for Snai1/2 (red) and (M) Lgr5-GFP (green); (N) merge shows Snai1 is present in both CBC stem cells and proliferating transit amplifying cells. Scale bars: 10 mm.
O, P Immunohistochemistry for Snai1 using a different primary antibody (Genetex GTX125918) shows minimal expression of Snai1 in villi. (P) Expression of Snai1 is detected at the base of crypts (P) with strong nuclear expression in CBC stem cells indicated by arrows. Scale bars: 20 mm (O), 10 mm (P).
Q Schematic diagram showing Snai1 expression (red) within different cell types in the crypt. SI = small intestine. See also Supplementary Fig S1.
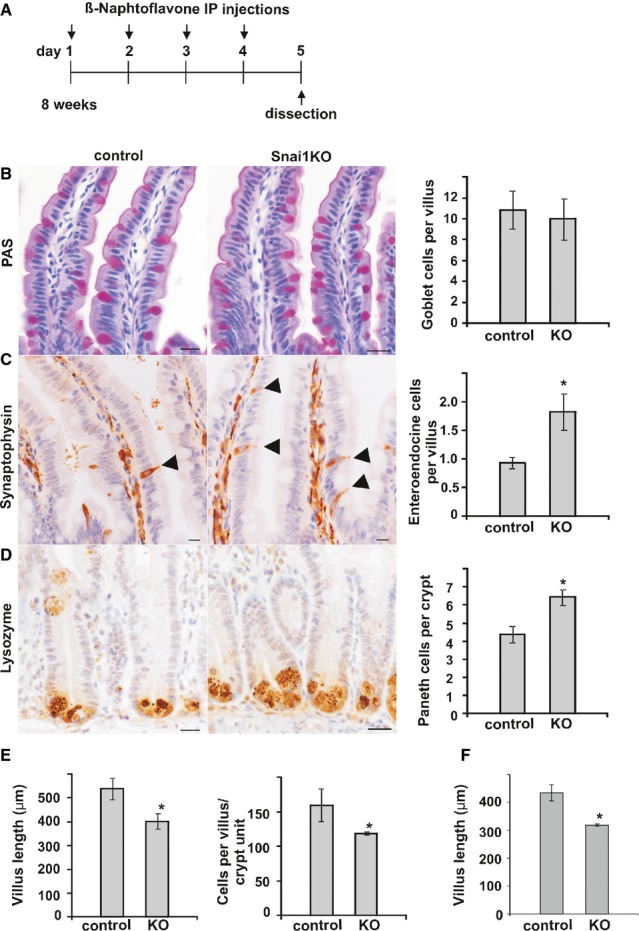
To analyse the effect of Snai1 knockout in the mouse small intestine, AhCre Snai1+/+ (control) and AhCre Snai1fl/del (test) adult mice were injected with β-NF on four consecutive days to induce Cre-mediated recombination. Tissue was harvested for analysis on day 5.
Periodic Acid Schiff (PAS) staining was used to detect goblet cells in sections of small intestine from control and Snai1 KO mice. Graph shows number of goblet cells per crypt–villus axes (n = 3).
Immunohistochemistry for synaptophysin was used to detect enteroendocrine cells (marked by arrows). Quantification of enteroendocrine cells per crypt–villus axes in control and Snai1 KO tissue revealed a significant increase in the number of enteroendocrine cells following Snai1 loss (n = 3, P = 0.004).
Immunohistochemistry for lysozyme was used to detect Paneth cells. Quantification of Paneth cells in control and Snai1 KO indicates a significant increase in Paneth cell numbers following knockout of Snai1 (n = 4, P = 0.002).
Measurement of villus length (μm) (n = 3, P = 0.013) and quantification of enterocytes per crypt–villus unit demonstrate a significant reduction in absorptive enterocytes following Snai1 loss (n = 3, P = 0.036).
Measurement of villus length (μm) (n = 3, P = 0.003) 8 days after β-NF induction demonstrates a significant shortening of villi. Bars represent mean ± SD. Two-tailed Student’s t-test was used to assess significance. Scale bars: 20 μm.
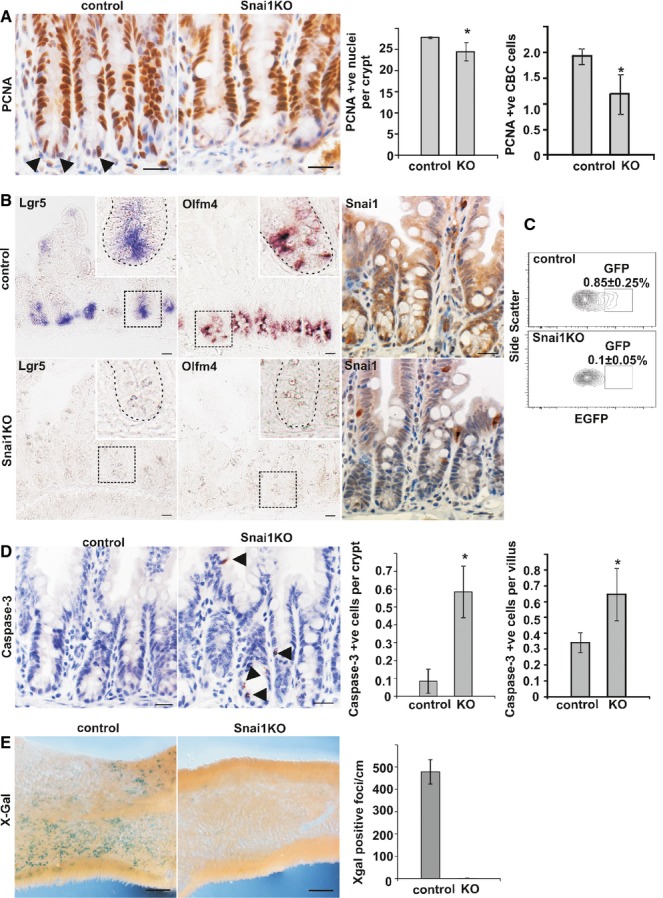
Sections from control and Snai1 KO small intestine were stained for PCNA to detect proliferating cells (arrows depicting proliferating CBC stem cells at the base of crypts). Quantification of total PCNA-positive cells per crypt and PCNA-positive cells in the base of crypts both revealed a significant reduction in the number of proliferating cells after conditional depletion of Snai1 (n = 4, P = 0.049, 0.026). Scale bars: 20 μm.
The expression of 2 CBC stem cell markers Olfm4 and Lgr5 were examined by in situ hybridisation in control and Snai1 KO small intestine. Lgr5 and Olfm4 in situ hybridisation staining shows a loss of CBC stem cell marker expression after loss of Snai1 (high magnification inserts depict a representative crypt demarcated by a dotted line). Loss of Snai1 was confirmed in knockout tissue using immunohistochemistry. Scale bars: 20 μm.
The analysis of sorted and EGFP-positive cells from Lgr5-EGFP-IRES-creERT2 AhCre Snai1fl/fl and Lgr5-EGFP-IRES-creERT2 AhCre Snai1+/+ mice 5 days after βNF induction show an ˜tenfold reduction in Lgr5 GFP-positive CBC stem cells.
Immunohistochemistry for active caspase-3 to detect apoptotic cells revealed a significant increase in the number of apoptotic cells in both crypt (n = 5, P = 0.0001) and villus (n = 5, P = 0.005) regions in Snai1KO tissue (arrows mark active caspase-3-positive cells). Scale bars: 20 μm.
A lineage tracing strategy was employed to determine the fate of CBC cells that lack Snai1. Tissue from Lgr5-EGFP-IRES-creERT2 Snai1+/+ (control) and Lgr5-EGFP-IRES-creERT2 Snai1fl/fl (Snai1KO) that also contained the ROSA26LacZ Cre reporter allele was stained with X-Gal 5 days after tamoxifen injection. Quantification of X-Gal-positive foci per cm shows Snai1 knockout tissue failed to lineage trace indicating that no progeny are produced from Snai1 knockout cells. Bars represent mean ± SD (n = 3, P = 0.0001). Scale bars: 0.50 mm. Two-tailed Student’s t-test was used to assess significance. See also Supplementary Figure S2.
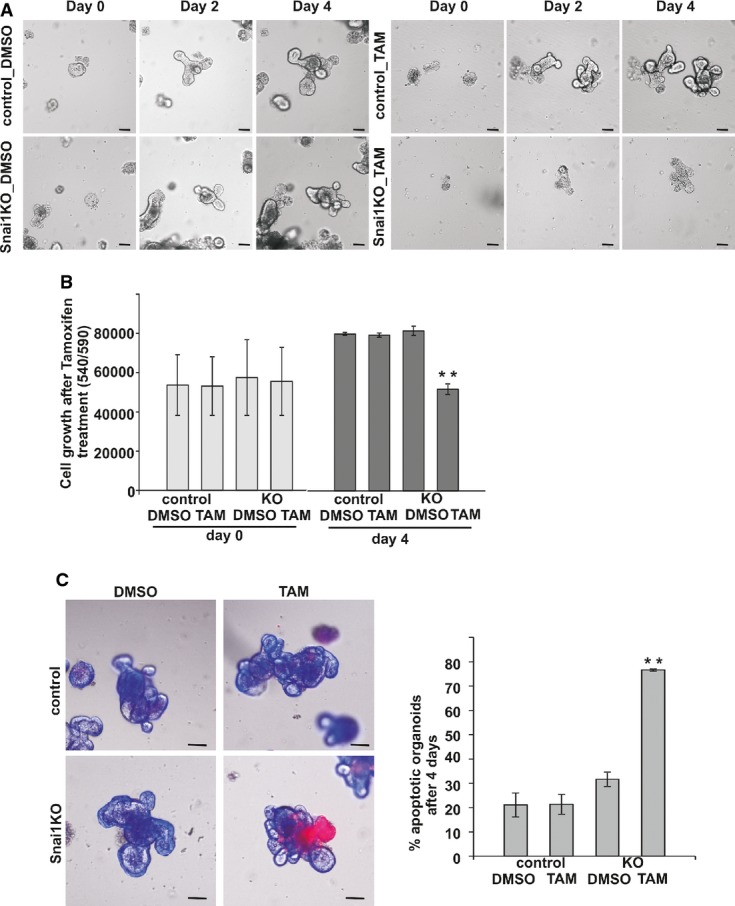
VillinCreERT2 Snai1fl/fl organoids treated with tamoxifen show arrested growth after 2 and 4 days of treatment compared to controls. Scale bars: 50 μm.
Quantification of viable cell growth in VillinCreERT2 Snai1fl/fl organoids treated with tamoxifen compared to controls over 4 days. Bars represent mean ± SD. n = 3 experiments per group, **P = 0.002.
Assessment of apoptosis in control and VillinCreERT2 Snai1fl/fl organoids after 4 days of growth. Photographs show an overlay of bright-field and fluorescent images with propidium iodide and Hoechst staining. Quantification of apoptotic organoids. Bars represent mean ± SD. n = 3 experiments per group, **P = 0.00001. Two-tailed Student’s t-test was used to assess significance. Scale bars: 50 μm. See also Supplementary Figure S3.
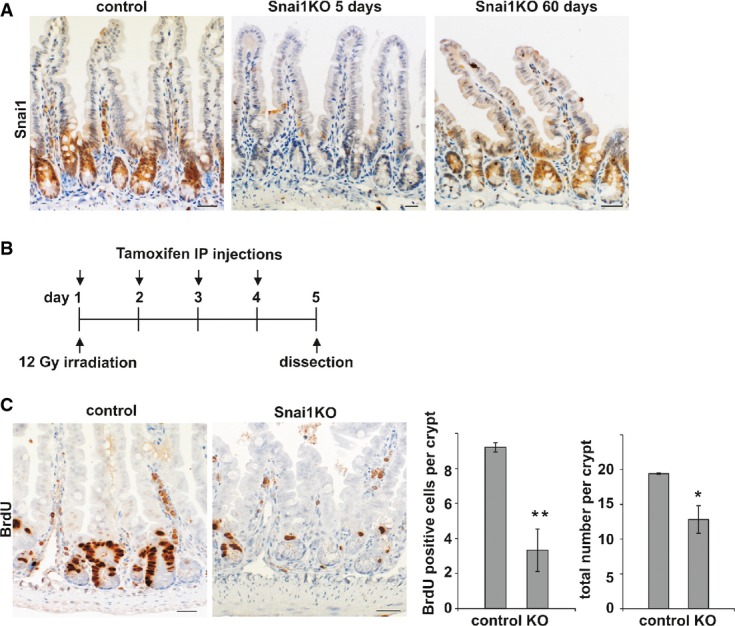
The consequences of Snai1 knockout were analysed over a time course. Immunohistochemistry for Snai1 revealed significant loss of expression at day 5 following induction compared to control. The epithelium is re-populated by wild-type cells as shown on day 60. Scale bars: 20 μm.
To analyse the effect of Snai1 knockout after radiation treatment in the mouse small intestine, VillinCreERT2 Snai1+/+ (control) and VillinCreERT2 Snai1fl/fl (test) adult mice were irradiated on day 1 and injected with tamoxifen on 4 consecutive days to induce Cre-mediated recombination. Tissue was harvested for analysis on day 5.
Sections from irradiated control and Snai1 KO small intestine were stained for BrdU to detect proliferating cells. Quantification of BrdU-positive cells per crypt and total number of cells per crypt revealed a significant reduction in both number of proliferating cells and total cells after irradiation and the conditional depletion of Snai1 (n = 4, P = 0.00019, 0.014). Bars represent mean ± SD. Two-tailed Student’s t-test was used to assess significance. Scale bars: 20 μm.
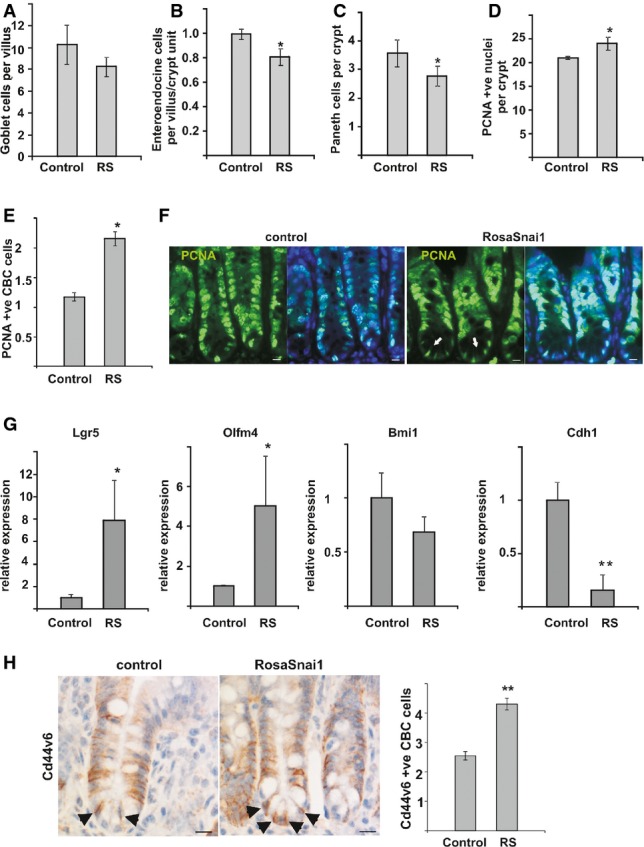
A PAS staining was used to detect goblet cells in the small intestine, and no differences in cell numbers were observed in test versus control mice (n = 4, NS).
B Immunohistochemistry for synaptophysin was used to detect enteroendocrine cells. Quantification of the number of enteroendocrine cells per crypt–villus axes revealed a significant decrease in enteroendocrine cell numbers when Snai1 levels are elevated (n = 4, P = 0.003).
C Immunohistochemistry for lysozyme was used to detect Paneth cells. Quantification of Paneth cell numbers indicated a significant decrease in Paneth cells in the base of crypts in mice with elevated Snai1 levels (n = 5, P = 0.027).
D, E Quantification of total PCNA-positive cells per crypt revealed a significant increase when Snai1 levels were elevated (n = 4, P = 0.009). This was confirmed in VillinCreERT2 ROSA26Snai1 mice 5 days after induction with tamoxifen where analysis of (E) PCNA-positive cells in the base of crypts revealed a significant increase in proliferating cells in crypts with elevated Snai1 levels compared to control tissue (n = 4, P = 0.0005). Bars represent mean ± SD.
F PCNA immunostaining (green) and DAPI staining (blue) of VillinCreERT2 ROSA26Snai1 compared to control VillinCreERT2 littermates. An expansion of proliferating CBC cells (indicated by arrows) is observed at the base of crypts. Scale bars: 10 μm.
G qRT–PCR analysis of stem cell marker expression in the small intestine from VillinCreERT2 ROSA26Snai1 compared to control VillinCreER2T littermates. Bars represent mean ± SD. n = 3 experiments per group, Olfm4 P = 0.013, Cdh1/E-cadherin P = 0.003, Lgr5 P = 0.013.
H CD44v6 immunostaining of tissue from AhCre control compared to AhCre RosaSnai1 tissue. A significant increase in CD44v6-positive cells localised at the base of crypts (depicted by arrows) was observed. Bars represent mean ± SD. n = 3 mice per group, *P = 0.00023. Two-tailed Student’s t-test was used to assess significance. Scale bars: 10 μm.
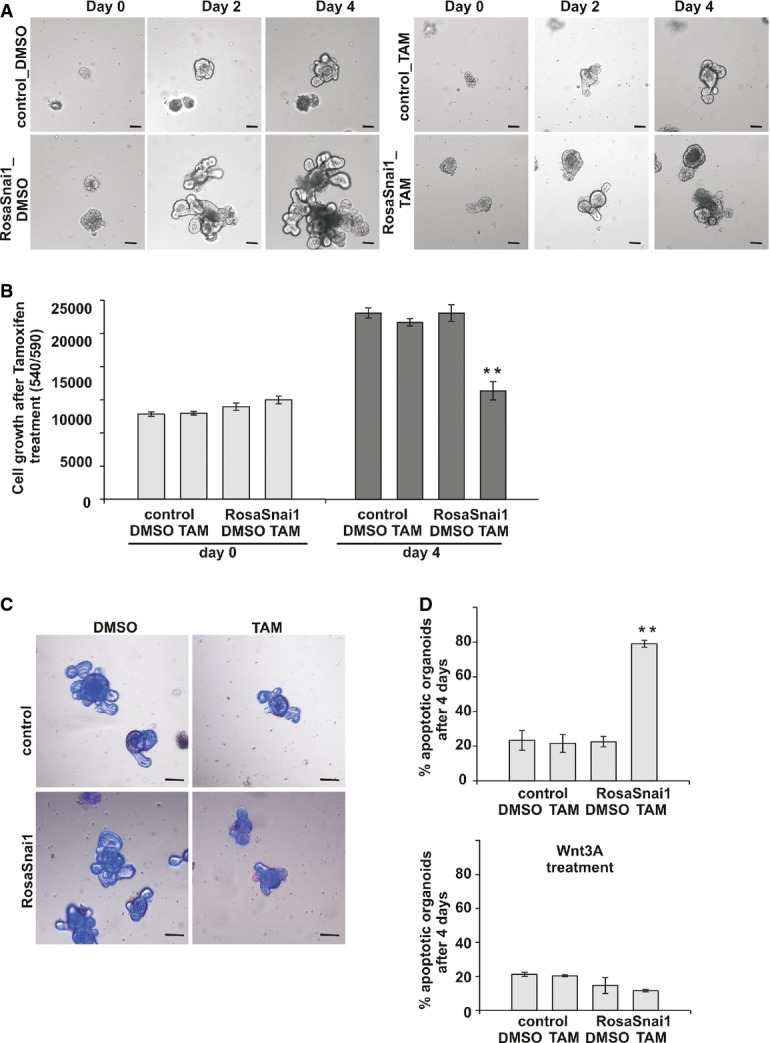
VillinCreERT2 RosaSnai1 organoids treated with tamoxifen show slower growth after 2 and 4 days of treatment compared to controls. Scale bars: 50 μm.
Quantification of viable cells in VillinCreERT RosaSnai1 organoids treated with tamoxifen compared to control growth over 4 days. Bars represent mean ± SD. n = 3 experiments per group, **P = 0.002.
Assessment of apoptosis in control and VillinCreERT2 RosaSnai1 organoids after 4 days of growth. Photographs show an overlay of bright-field, propidium iodide and Hoechst fluorescence. Scale bars: 50 μm.
Quantification of apoptotic organoids with and without Wnt3A treatment shown as mean ± SD. n = 3 experiments per group, **P = 0.00003. Two-tailed Student’s t-test was used to assess significance.
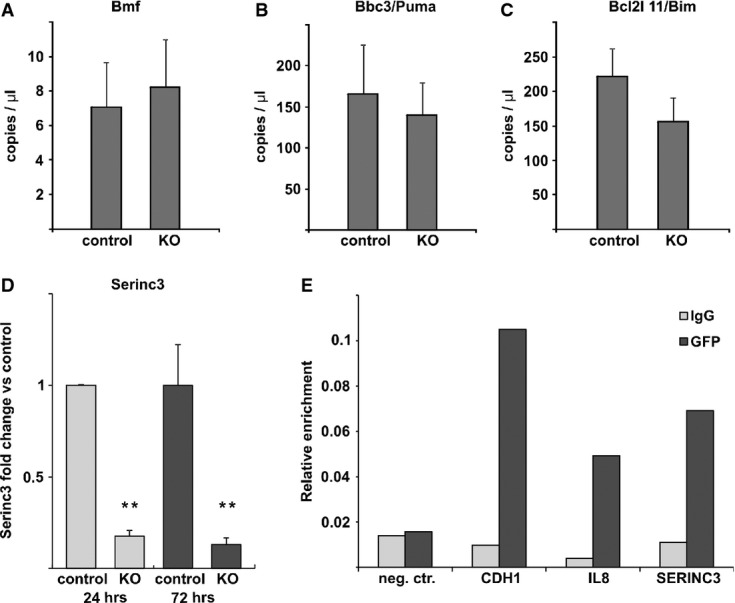
A–C Droplet digital PCR analysis of Bmf, Bbc3/Puma and Bcl2l 11/Bim after conditional Snai1 loss in in vitro organoid culture. VillinCreERT2 Snai1+/+ (control) and VillinCreERT2 Snai1fl/fl SI organoids were treated for 24 h with tamoxifen. No differences in gene expression were observed (n = 3).
D qRT–PCR analysis of Serinc3 downregulation after conditional Snai1 loss in in vitro organoid culture. VillinCreERT2 Snai1+/+ (control) and VillinCreERT2 Snai1fl/fl SI organoids were treated for 24 (P = 0.0001) and 72 h (P = 0.006) with tamoxifen. Bars represent mean ± SD. n = 3 mice per group.
E SW480 cells, which transiently express GFP-SNAI1, were used to detect direct binding of SNAI1 to the promoters of known target genes CDH1, IL8 and a novel target SERINC3 revealed by microarray analysis. An unrelated DNA region was used as a negative control. Anti-GFP antibody was used to immunoprecipitate GFP-tagged SNAI1, while IgG control antibody was used as a negative control. The results are given as relative enrichment compared to input material and are representative of three independent experiments.
Comment in
-
Gut stem cells, a story of snails, flies and mice.EMBO J. 2015 May 12;34(10):1287-9. doi: 10.15252/embj.201591541. Epub 2015 Apr 11. EMBO J. 2015. PMID: 25863942 Free PMC article.
References
-
- Barker N, van Es JH, Kuipers J, Kujala P, van den Born M, Cozijnsen M, Haegebarth A, Korving J, Begthel H, Peters PJ, Clevers H. Identification of stem cells in small intestine and colon by marker gene Lgr5. Nature. 2007;449:1003–1007. - PubMed
-
- Barker N. Adult intestinal stem cells: critical drivers of epithelial homeostasis and regeneration. Nat Rev Mol Cell Biol. 2014;15:19–33. - PubMed
-
- Barrallo-Gimeno A, Nieto MA. The Snail genes as inducers of cell movement and survival: implications in development and cancer. Development. 2005;132:3151–3161. - PubMed
-
- Batlle E, Sancho E, Franci C, Dominguez D, Monfar M, Baulida J, Garcia De Herreros A. The transcription factor snail is a repressor of E-cadherin gene expression in epithelial tumour cells. Nat Cell Biol. 2000;2:84–89. - PubMed
-
- Bossolasco M, Veillette F, Bertrand R, Mes-Masson AM. Human TDE1, a TDE1/TMS family member, inhibits apoptosis in vitro and stimulates in vivo tumorigenesis. Oncogene. 2006;25:4549–4558. - PubMed
Publication types
MeSH terms
Substances
Grants and funding
LinkOut - more resources
Full Text Sources
Other Literature Sources
Molecular Biology Databases
Research Materials
