. 2015 Mar 10;8(367):ra27.
doi: 10.1126/scisignal.aaa0899.

Phosphorylation of eIF2α triggered by mTORC1 inhibition and PP6C activation is required for autophagy and is aberrant in PP6C-mutated melanoma

Affiliations

Phosphorylation of eIF2α triggered by mTORC1 inhibition and PP6C activation is required for autophagy and is aberrant in PP6C-mutated melanoma

Jordan Wengrod et al. Sci Signal. .

Abstract

Amino acid deprivation promotes the inhibition of the kinase complex mTORC1 (mammalian target of rapamycin complex 1) and activation of the kinase GCN2 (general control nonrepressed 2). Signaling pathways downstream of both kinases have been thought to independently induce autophagy. We showed that these two amino acid-sensing systems are linked. We showed that pharmacological inhibition of mTORC1 led to activation of GCN2 and phosphorylation of the eukaryotic initiation factor 2α (eIF2α) in a mechanism dependent on the catalytic subunit of protein phosphatase 6 (PP6C). Autophagy induced by pharmacological inhibition of mTORC1 required PP6C, GCN2, and eIF2α phosphorylation. Although some of the PP6C mutants found in melanoma did not form a strong complex with PP6 regulatory subunits and were rapidly degraded, these mutants paradoxically stabilized PP6C encoded by the wild-type allele and increased eIF2α phosphorylation. Furthermore, these PP6C mutations were associated with increased autophagy in vitro and in human melanoma samples. Thus, these data showed that GCN2 activation and phosphorylation of eIF2α in response to mTORC1 inhibition are necessary for autophagy. Additionally, we described a role for PP6C in this process and provided a mechanism for PP6C mutations associated with melanoma.


Figures

Fig 1
Fig 1
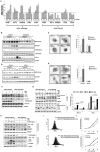
mTORC1 inhibition induces eIF2α phosphorylation. A. Cell lines were treated with 100nM rapamycin (Rap) or tunicamycin (Tm) for six hours and eIF2α phosphorylation was assessed by immunoblot. Representative blots are displayed and quantitations reflect average and standard error (N=3 biological replicates). B. Primary MEFs and BJhTERT cells were treated with rapamycin for the indicated times or tunicamycin and eIF2α phosphorylation was assessed. Quantitation reflects average and standard error (N=3 biological replicates). C. U2OS cells were treated with rapamycin, tunicamycin, or depleted of rictor or raptor, and eIF2α phosphorylation was assessed. Representative blots are displayed and quantitation reflects average values (N=2 biological replicates).
Fig 2
Fig 2
eIF2α phosphorylation is necessary for rapamycin induced autophagy. A. Wild-type and eIF2α S51A MEFs were treated with 100 nM rapamycin (Rap) for the indicated times, and the expression of ATF-4 transcriptional targets were assessed by real time PCR. Average and standard error are shown (N=3 biological replicates). B. Wild-type and eIF2α S51A/S51A MEFs stably expressing GFP-LC3 were treated with 300nM rapamycin for the indicated times (hours) or tunicamycin for 24 hours. Cell lysates were then immunoblotted for GFP and phosphorylated eIF2α (S51). A representative blot from two biologically replicated experiments is displayed. C. Wild-type and eIF2α S51A MEFs were treated with 300nM rapamycin for 8 hours and endogenous LC3 foci were visualized (left panel) and quantitated (right panel). p values determined by Wilcoxon Rank Sum test; N=3 biological replicates with greater than 200 cells counted in each experiment. D. Wild-type and ATF4 knockout MEFs stably expressing GFPLC3 were treated with 300nM rapamycin for the indicated times (hours) or tunicamycin for 24 hours and the lysates were immunoblotted for GFP. A representative blot from two biologically replicated experiments is displayed. E. Wild-type and ATF-4 knockout MEFs were treated with 300nM rapamycin for 8 hours and endogenous LC3 foci were visualized and quantified from 200 cells. p values determined by Wilcoxon Rank Sum test; N=3 biological replicates with greater than 200 cells counted in each experiment. F. eIF2α wild-type and S51A/S51A cells were treated with 100 nM rapamycin in the absence or presence or 60 μM chloroquine (CQ), or CQ alone, and immunoblots were performed. Total eIF2α serves as a loading control. G. TSC wild-type (top) and deficient (bottom) MEFs, expressing either gadd34 or a control, were treated with 100 nM rapamycin in the absence or presence or 60 μM chloroquine (CQ), or CQ alone, and immunoblots were performed. A representative blot is displayed, with average p62 expression (left) and LC3II/LCI ratios (right) displayed (N=2-3 biological replicates). p values calculated by Students T test. H. ULK1/2 wildtype (top) and deficient (bottom) MEFs, expressing either gadd34 or a control, were treated with 100 nM rapamycin in the absence or presence or 60 μM chloroquine (CQ), or CQ alone, and immunoblots were performed. A representative blot from two biologically replicated experiments is displayed. I. Wild-type and eIF2α S51A MEFs were treated with 300nM rapamycin for 72 hours and cell size was measured by forward scatter flow cytometric analysis. Average fluoresence of replicate experiments (N=2 biological replicates) is shown J. Wild-type and eIF2α S51A MEFs were treated with 300nM rapamycin for the times indicated and proliferation was determined by crystal violet staining and OD measurement with average and standard error displayed (N= 3 biological replicates).
Fig 3
Fig 3
mTORC1 inhibition phosphorylates eIF2α through the GCN2 kinase. A. Wild-type and GCN2 knockout MEFs were treated with 300nM rapamycin for the indicated times (hours), tunicamycin for 12 hours, or amino acid deprivation for 12 hours. Cell lysates were then immunoblotted for GFP. A representative blot is displayed (left) and quantitation reflects average of two biological replicates (right) B. HeLa cells were treated with 300nM rapamycin for the indicated times, deprived of leucine for 2 hours, or treated with tunicamycin for 4 hours and cell lysates were then immunoblotted. A representative blot is displayed (left) and average quantitation reflects average of two biological replicates (right) C. Wild-type and TSC2 knockout MEFs were incubated in leucine deficient media (10.5mg/L) or D. histidinol for the indicated times and cell lysates were then immunoblotted. A representative blot is displayed (left) and average quantitation reflects average of two biological replicates (right)
Fig 4
Fig 4
Rapamycin leads to eIF2α phosphorylation and autophagy through activation of PP6C. A. HCT-116 and HeLa cells stably expressing a control retroviral vector or a vector expressing PP6C were assessed for GCN2 and/or eIF2α phosphorylation. Representative blots are displayed (N=2 biological replicates). B. U2OS cells stably expressing either a control, or shPP6C lentivirus were treated with 300nM rapamycin for the times indicated (hours) or tunicamycin for 12 hours. Protein lysates were then immunoblotted for phosphorylated eIF2α and other noted proteins. A representative blot is displayed (left) and quantitation reflects average of two biological replicates (right). C. HeLa cells stably expressing either a control, or shIGBP1 lentivirus were treated with 300nM rapamycin for the times indicated (hours) or tunicamycin for 12 hours. Protein lysates were then immunoblotted, with a representative blot (left) and quantitation reflective of the average of two biological replicates (right). D. Scramble (con) and PP6C depleted cells were treated with rapamycin for 6 hours and phosphorylated and total GCN2 levels were assessed. A representative blot is displayed (left) and quantitation reflects average of two biological replicates (right).
Fig 5
Fig 5
PP6C, PP6Rs, and GCN2 form a complex that is necessary eIF2α phosphorylation and is dissociated with PP6C mutants found in melanoma. A. HeLa cells were harvested and lysates were immunoprecipitated with protein G beads conjugated to antibodies targeting GFP, PP6R1, PP6R2, or PP6R3. Whole cell extract input (WCE) and immunoprecipitated samples were then immunoblotted for endogenous PP6Rs, GCN2, and PP6C. B. Lysates from U2OS cells stably expressing Flag-tagged PP6R1, PP6R2, or PP6R3 and stably expressing a scramble (SCR) or corresponding shRNA were immunoblotted. A representative blot is displayed with average phosphorylated eIF2α/total eIF2α expression quantitated (N=2 biological replicates). C. Lysates from U2OS cells stably expressing either a control or three shRNAs targeting PP6R1, PP6R2, and PP6R3 were immunoblotted for PP6C, phosphorylated eIF2α, and other noted proteins. A representative blots is displayed (N=2 biological replicates). D. U2OS cells stably expressing either a control or three shRNAs targeting PP6R1, PP6R2, and PP6R3 were treated with 300nM rapamycin for the times indicated and cell lysates were immunoblotted. A representative blot is displayed (top) with average phosphorylated eIF2α/total eIF2α expression quantitated (bottom) (N=2 biological replicates). E. 293T cells were co-transfected with vector expressing a Myc-tagged PP6C mutant and a vector expressing Flag-PP6R1, Flag-PP6R2, or Flag-PP6R3. Lysates were immunoprecipitated with sepharose beads conjugated to an anti-Flag antibody, and lysates were then immunoblotted. Representative blots are displayed (N=2 biological replicates). F. Lysates from HCT-116 cells stably expressing a Myc-tagged PP6C mutant or were immunoblotted. A representative blots is displayed (N=2 biological replicates). G. U2OS cells stably expressing a Myc-tagged PP6C expression retrovirus were treated with 100μg/mL cycloheximide for the times indicated. Cell lysates were then immunoblotted for PP6C. A representative blots is displayed (left) with expression of exogenous PP6C graphed as a function of time (right) from 2 biological replicates). H. Dot-plot of the half-life of mutants that bind to the PP6Rs (N=5) versus mutants that do not bind (N=4) with standard error displayed. I. Half-lives were calculated for each PP6C mutant and correlated with its ability to bind to the PP6Rs with the Pearson correlation coefficient (R2) is displayed (N=8). J. Lysates from U2OS cells stably expressing a Myc-tagged PP6C mutant or D84N catalytic mutant in addition to a control or shPP6C (targeting the 3’UTR) lentivirus were immunoblotted for PP6C and phosphorylate eIF2α. A representative blot is displayed (top) with average phosphorylated eIF2α/total eIF2α expression quantitated (bottom) (N=2 biological replicates). K. Dot-plot of the half-life of endogenous PP6C in U2OS cells expressing stable (N=4) or unstable (N=4) PP6C mutants.
Fig 6
Fig 6
Autophagy is increased with PP6C mutations that disrupt regulatory subunit binding. A. GFP-LC3 HCT116 cells expressing empty vector, wild-type PP6C, or mutated PP6C, were treated with vehicle, Rapamycin 100 nM for 6 hours, 60 μM Chloroquine (CQ) for 2 hours, or both and immunoblots for GFP and tubulin were performed. A representative blot is displayed with average GFP/tubulin quantitated (N=2 biological replicates). B. Primary cell cultures of wild-type and PP6C mutated melanoma tumors were treated as in A and immunbloted for LC3 and p62. A representative blot is displayed with average p62/tubulin quantitated (N=2 biological replicates). C. Melanoma tumors were genotyped for PP6C and stained for LC3 and blindly evaluated for percentage of cells with LC3 foci as described in the text. LC3 and phosphorylated eIF2α expression were assessed by IF and IHC respectively, and expression was graded as 0 (<25% cells with expression), 1 (25%-50% cells with expression), 2 (50%-75% of cells with expression) and 3 (>75% cells with expression. Representative images, including both melanoma (M) and normal skin (N) with increasing phosphorylated eIF2α and LC3 foci are displayed (top). Foci from tumors with wild-type PP6C (n=12), harboring PP6C mutations which bind to regulatory subunits (n=6) or PP6C mutations which do not bind to regulatory subunits (n=6) are shown. p values determined from Wilcoxon Ranks Sum Test.
Fig 7
Fig 7
Proposed model of mTORC1 regulation of eIF2α phosphorylation through PP6C-mediated activation of GCN2. A. Under periods of nutrient deprivation, mTORC1 inhibition activates PP6C. PP6C then associates with GCN2 in a complex with a PP6 regulatory protein. PP6C subsequently dephosphorylates GCN2, promoting its activation. Activated GCN2 then leads to the phosphorylation of eIF2α and induction of autophagy. PP6C can also dissociate from the PP6 regulatory proteins, which decreases its stability. B. Several PP6C mutants found in melanoma are unable to bind to the PP6Rs and are rapidly degraded. This causes an increase in wild-type PP6C stability, sensitizing the cells autophagy induction in response to mTORC1 inhibition.

Similar articles

Cited by

References

    1. Laplante M, Sabatini DM. mTOR signaling in growth control and disease. Cell. 2012;149:274–293. - PMC - PubMed
    1. Kim J, Kundu M, Viollet B, Guan KL. AMPK and mTOR regulate autophagy through direct phosphorylation of Ulk1. Nat Cell Biol. 2011;13:132–141. - PMC - PubMed
    1. Harding HP, Zhang Y, Zeng H, Novoa I, Lu PD, Calfon M, Sadri N, Yun C, Popko B, Paules R, Stojdl DF, Bell JC, Hettmann T, Leiden JM, Ron D. An integrated stress response regulates amino acid metabolism and resistance to oxidative stress. Mol Cell. 2003;11:619–633. - PubMed
    1. Ye J, Kumanova M, Hart LS, Sloane K, Zhang H, De Panis DN, Bobrovnikova-Marjon E, Diehl JA, Ron D, Koumenis C. The GCN2-ATF4 pathway is critical for tumour cell survival and proliferation in response to nutrient deprivation. EMBO J. 2010;29:2082–2096. - PMC - PubMed
    1. Rzymski T, Milani M, Pike L, Buffa F, Mellor HR, Winchester L, Pires I, Hammond E, Ragoussis I, Harris AL. Regulation of autophagy by ATF4 in response to severe hypoxia. Oncogene. 2010;29:4424–4435. - PubMed

Publication types

MeSH terms