. 2015 Feb 24:9:19.
doi: 10.3389/fnana.2015.00019. eCollection 2015.

Scalable and DiI-compatible optical clearance of the mammalian brain

Affiliations

Scalable and DiI-compatible optical clearance of the mammalian brain

Bing Hou et al. Front Neuroanat. .

Abstract

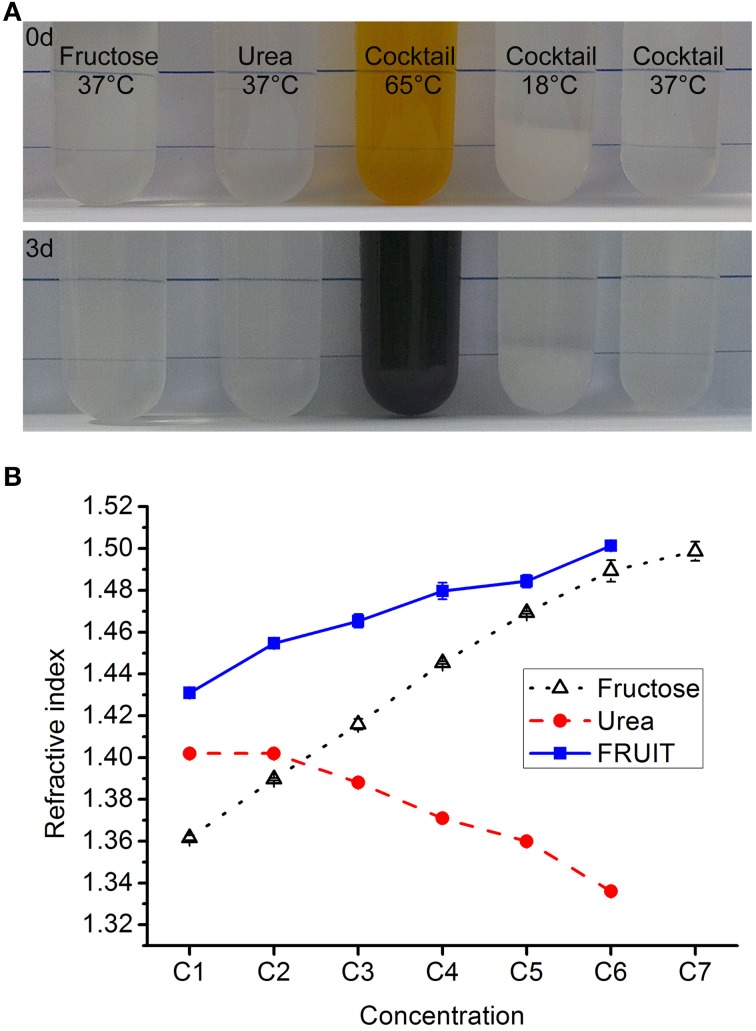
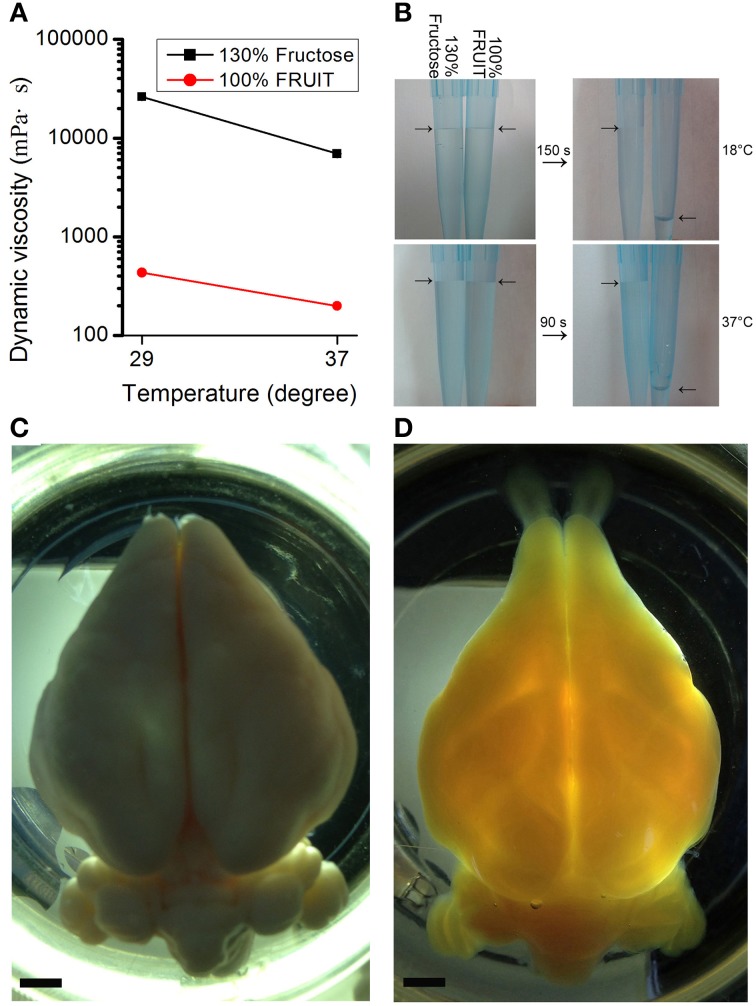
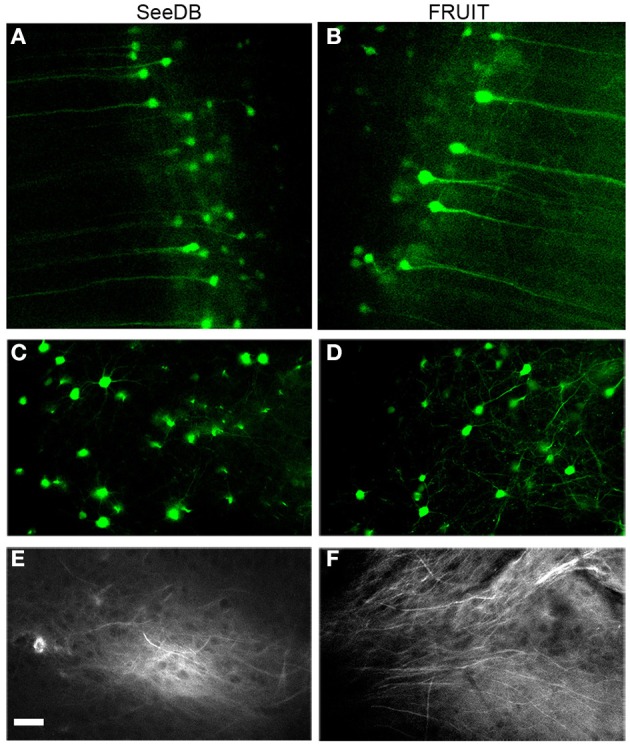
Efficient optical clearance is fundamental for whole brain imaging. In particular, clearance of the brain without membrane damage is required for the imaging of lipophilic tracer-labeled neural tracts. Relying on an ascending gradient of fructose solutions, SeeDB can achieve sufficient transparency of the mouse brain while ensuring that the plasma membrane remains intact. However, it is challenging to extend this method to larger mammalian brains due to the extremely high viscosity of the saturated fructose solution. Here we report a SeeDB-derived optical clearing method, termed FRUIT, which utilizes a cocktail of fructose and urea. As demonstrated in the adult mouse brain, combination of these two highly water-soluble clearing agents exerts a synergistic effect on clearance. More importantly, the final FRUIT solution has low viscosity so as to produce transparency of the whole adult rabbit brain via arterial perfusion, which is impossible to achieve with a saturated fructose solution. In addition to good compatibility with enhanced yellow fluorescent protein, the cocktail also preserves the fluorescence of the lipophilic tracer DiI. This work provides a volume-independent optical clearing method which retains the advantages of SeeDB, particularly compatibility with lipophilic tracers.

Keywords: 3DISCO; CLARITY; CUBIC; SeeDB; Urea; optical tissue clearing; tract tracing; whole brain imaging.


Figures

Figure 1
Figure 1
Composition of the cocktail. (A) The fructose solution (80% in wt/vol), urea solution (24% in wt/vol, equal to 4 M), and cocktail solution containing 80% fructose and 24% urea all remained stable in terms of appearance over 3 days at 37°C. In contrast, the cocktail solution turned from light brown to dark brown if kept at 65°C, whereas 8 g fructose and 2.4 g urea could not be fully dissolved in 10 ml of aqueous solution at 18°C. (B) The refractive index (RI) of the different clearing solutions presented as mean ± SD (n = 3). The composition of these solutions is shown in Supplementary Tables 1–3.
Figure 2
Figure 2
Transmittance curves of clearing solutions. (A,B) The transmittance of SeeDB (A) or FRUIT (B) solutions at different concentrations, normalized against pure water. The transmittance of the solutions exceeded the baseline in the band from 930 to 1000 nm, particularly at about 970 nm, because water itself substantially absorbs light at near-infrared wavelengths (Hale and Querry, 1973). (C,D) The corrected transmittance curves of the SeeDB (C) and FRUIT (D) solutions at different concentrations, normalized against air and the blank (see Materials and Methods).
Figure 3
Figure 3
Optical clearance of the adult mouse brain. (A) Schematic diagram of different clearing procedures. FRUIT (20:115) denotes a FRUIT gradient starting at 20% and ending at 115% whereas FRUIT (0.5PBS) means that the FRUIT solutions from 20 to 80% were prepared with 0.5×PBS instead of water. (B,C) Transmittance curves of hemi-brains processed with SeeDB (B) and FRUIT (20:115) (C), respectively. PFA, paraformaldehyde. (D) Comparison of normalized transmittance at 920 nm between hemi-brains treated with SeeDB and FRUIT (20:115) across different concentrations. (E,F) Transmittance curves of hemi-brains after treatment with a descending gradient of urea solutions (E) and Scale A2 solution (F), respectively. (G) Transmittance curves of the left and right halves of a brain processed with FRUIT (20:100) and FRUIT (20:83), respectively. (H) Transmittance curves of the left and right halves of a brain before and after (upper right inset) treatment with FRUIT (35:100) or FRUIT solutions using 0.5 × PBS as the solvent (in PBS). The y axis in the inset is at ten times lower magnification than that in the main panel. (I) Transmittance curves of the left and right halves of a brain before and after (upper right inset) treatment with SeeDB or FRUIT (35:100). The y axis in the inset is at ten times lower magnification than that in the main panel. (J,K) Visible-light (J) and infrared (K) photographs of hemi-brains cleared with FRUIT (35:100) (left) or SeeDB (right). (L) Normalized laser intensity through the samples before and after treatment with SeeDB or FRUIT (35:100). The laser intensity from FRUIT-processed hemi-brains was lower than that through SeeDB-processed hemi-brains in the direction perpendicular to the incident laser, but was higher in the direction of the incident laser, implying that FRUIT was more effective at reducing scattering. The assessment of light scattering is schematically illustrated in Supplementary Figure 2.
Figure 4
Figure 4
Control of tissue deformation. (A) The hemi-brains were sequentially treated with a gradient of SeeDB (upper row) or FRUIT (20:115) (lower row) solutions at 37°C. The final volumes of the brain samples show expansion after treatment with the FRUIT (20:115) but not the SeeDB protocol. For FRUIT-processed samples, the final size is seemingly equal to the size after 8 h incubation in the initial concentration of FRUIT, i.e., 20% FRUIT, regardless of the dynamic volume change across the gradient of FRUIT solutions. PFA, paraformaldehyde. (B) The hemi-brains before (upper row) and after (lower row) the 8 h incubation in single concentrations of FRUIT solutions at 37°C. Only 35% FRUIT is able to preserve the original size of the brain, whereas a lower or higher concentration causes expansion or shrinkage. (C) The hemi-brains before (upper row) and after (lower row) sequential treatment with the gradient of FRUIT solutions at 37°C starting from different concentrations. The gradient of FRUIT solutions starting from 35% preserved brain size well, whereas those with a lower or higher start concentration deformed the brain. (D) The hemi-brains before (upper row) and after (lower row) treatment with FRUIT solutions using 0.3 × PBS or 0.5 × PBS as the solvent at 37°C. 0.5 × PBS in 20–80% FRUIT solutions is sufficient to control expansion of the brain. This figure was set to demonstrate the changes of brain sizes in air in the epi-illumination mode (up-down). Brain transparency would be significantly improved by photographing the samples in solutions in the trans-illumination mode (down-up), as shown in Figures 3J, K. Grid size: 5 × 5 mm.
Figure 5
Figure 5
Viscosity-dependent arterial perfusion of clearing agents. (A) The dynamic viscosity of different clearing solutions presented as mean ± SD (n = 3). 100% FRUIT was 30 times less viscous than 130% fructose solution. (B) Fluidity test of the clearing solutions. 100% FRUIT ran out through the pipette within 150 s at 18°C (upper row) and within 90 s at 37°C (lower row) whereas 130% fructose hardly fell. (C,D) Adult rabbit brains after arterial perfusion of paraformaldehyde (C) or the gradient of FRUIT solutions (D). Perfusion of FRUIT solutions rendered the whole brain transparent whereas 130% SeeDB was too viscous to be arterially perfused. An adult rabbit brain is about 20 times larger in volume than an adult mouse brain. Bar = 5 mm.
Figure 6
Figure 6
Compatibility with fluorescent proteins or lipophilic tracers. (A, B) Two-photon imaging of cortical pyramidal neurons in Thy1-eYFP (line H) mouse brains cleared with SeeDB (A) or FRUIT (20:115) (B). The fluorescence of cytosolic eYFP was well preserved after treatment with FRUIT (20:115), but the neurons appeared to swell, which is in accordance with the gross appearance of the FRUIT (20:115)-treated brains (see Figure 4A). (C,D) Two-photon imaging of striatal neurons in Thy1-eYFP (line H) mouse brains cleared with SeeDB (C) or FRUIT (35:100), which effectively controlled the brain expansion (D). (E,F) Two-photon imaging of DiI-labeled mouse brains after treatment with SeeDB (E) or FRUIT (35:100) which cause no deformation (F). Like SeeDB, FRUIT preserved the fluorescence of fluorescent proteins or lipophilic tracers. Bar = 50 μm.

References

    1. Becker K., Jahrling N., Saghafi S., Weiler R., Dodt H. U. (2012). Chemical clearing and dehydration of GFP expressing mouse brains. PLoS ONE 7:e33916. 10.1371/journal.pone.0033916 - DOI - PMC - PubMed
    1. Boutin M. E., Hoffman-Kim D. (2014). Application and assessment of optical clearing methods for imaging of tissue-engineered neural stem cell spheres. Tissue Eng. Part C Methods. [Epub ahead of print]. Available online at: http://online.liebertpub.com/doi/abs/10.1089/ten.TEC.2014.0296?url_ver=Z... 10.1089/ten.tec.2014.0296 - DOI - DOI - PMC - PubMed
    1. Chung K., Wallace J., Kim S. Y., Kalyanasundaram S., Andalman A. S., Davidson T. J., et al. . (2013). Structural and molecular interrogation of intact biological systems. Nature 497, 332–337. 10.1038/nature12107 - DOI - PMC - PubMed
    1. DeFelipe J. (2010). From the connectome to the synaptome: an epic love story. Science 330, 1198–1201. 10.1126/science.1193378 - DOI - PubMed
    1. Dodt H. U., Leischner U., Schierloh A., Jahrling N., Mauch C. P., Deininger K., et al. . (2007). Ultramicroscopy: three-dimensional visualization of neuronal networks in the whole mouse brain. Nat. Methods 4, 331–336. 10.1038/nmeth1036 - DOI - PubMed