. 2015 Feb 24:6:24.
doi: 10.3389/fphys.2015.00024. eCollection 2015.

The Open Physiology workflow: modeling processes over physiology circuitboards of interoperable tissue units

Affiliations

The Open Physiology workflow: modeling processes over physiology circuitboards of interoperable tissue units

Bernard de Bono et al. Front Physiol. .

Abstract

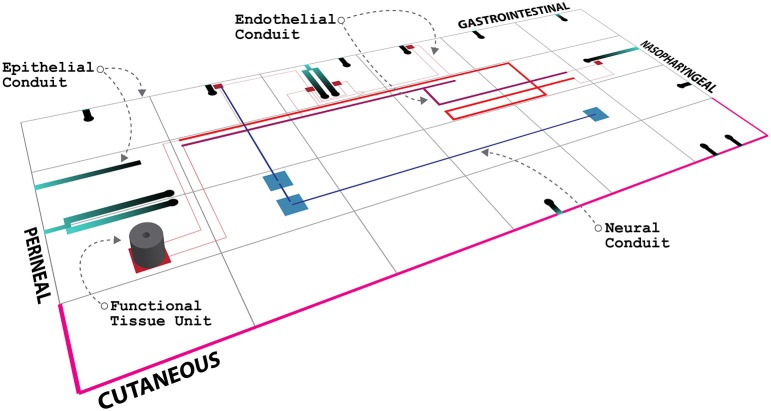
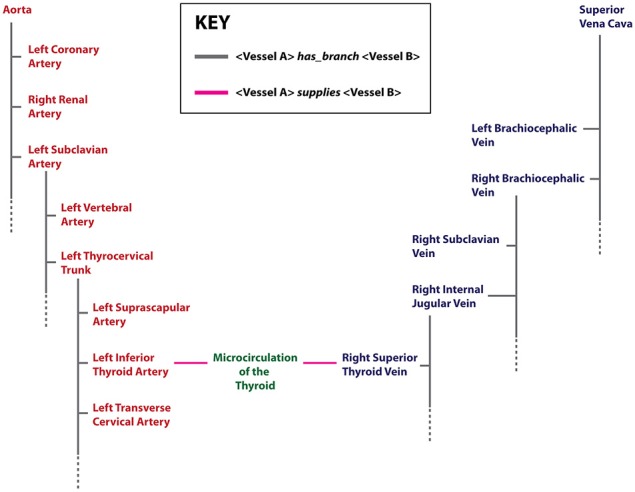
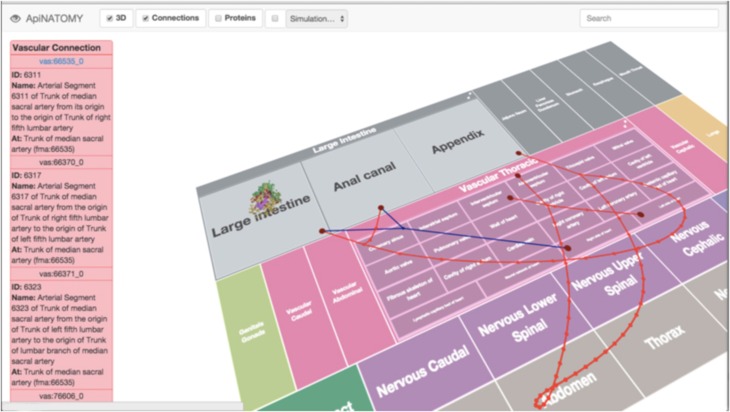
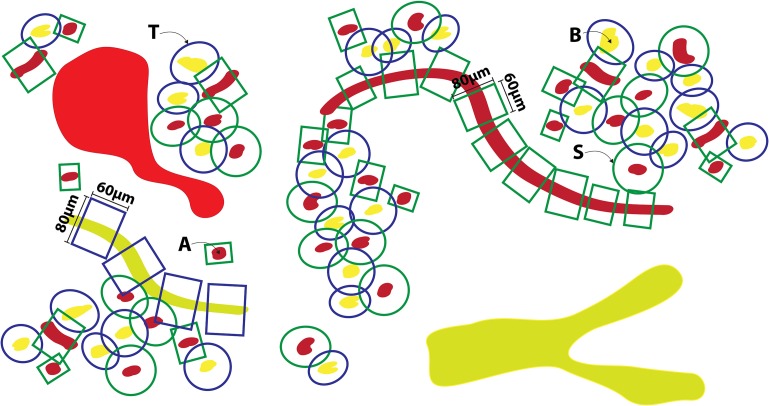
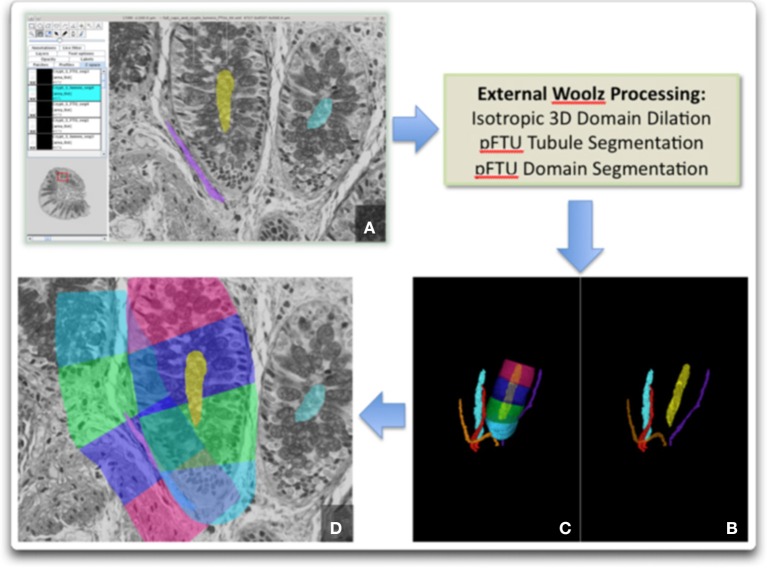
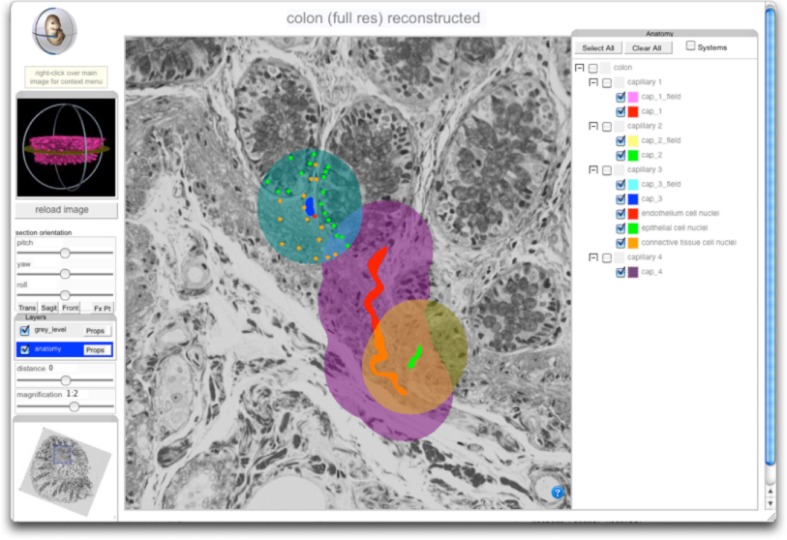
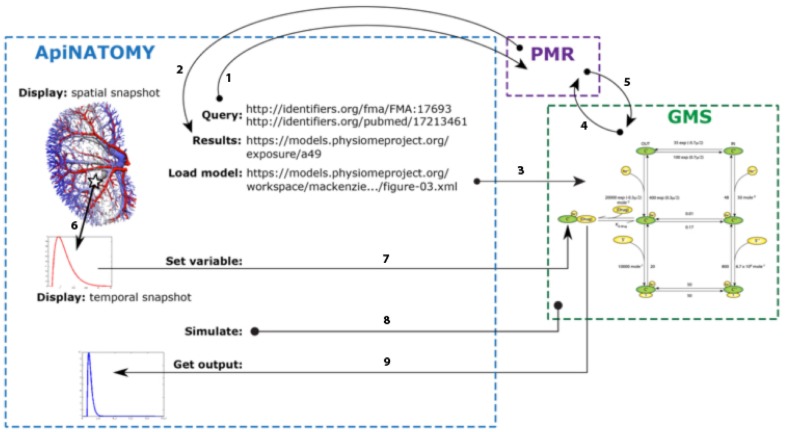
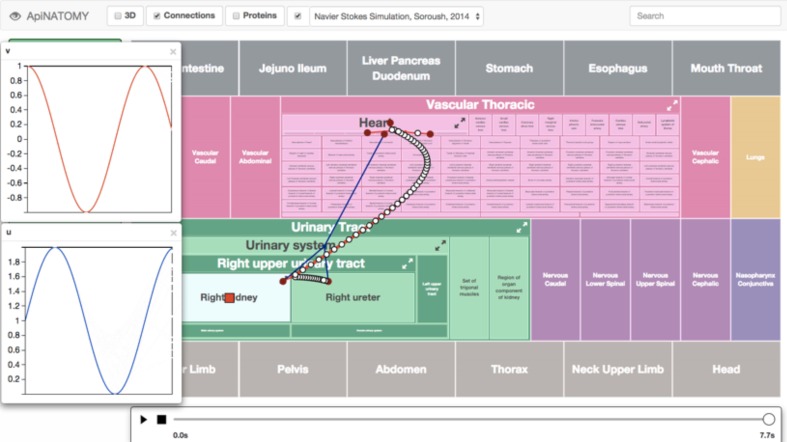
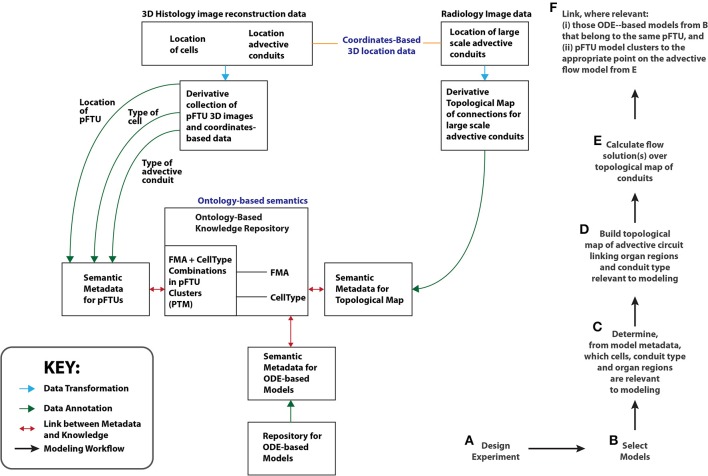
A key challenge for the physiology modeling community is to enable the searching, objective comparison and, ultimately, re-use of models and associated data that are interoperable in terms of their physiological meaning. In this work, we outline the development of a workflow to modularize the simulation of tissue-level processes in physiology. In particular, we show how, via this approach, we can systematically extract, parcellate and annotate tissue histology data to represent component units of tissue function. These functional units are semantically interoperable, in terms of their physiological meaning. In particular, they are interoperable with respect to [i] each other and with respect to [ii] a circuitboard representation of long-range advective routes of fluid flow over which to model long-range molecular exchange between these units. We exemplify this approach through the combination of models for physiology-based pharmacokinetics and pharmacodynamics to quantitatively depict biological mechanisms across multiple scales. Links to the data, models and software components that constitute this workflow are found at http://open-physiology.org/.

Keywords: ApiNATOMY; fluid flow modeling; functional tissue units; histology; physiology circuit-boarding; physiology-based pharmacokinetics; visual knowledge management.


Figures

Figure 1
Figure 1
Mock-up of an ApiNATOMY circuitboard display, showing the anatomical layout of a tiled depiction of body regions, together with an edge-based illustration of advective conduits, as well as a cylindrical pFTU.
Figure 2
Figure 2
An example of terms and relations relevant to cardiovascular knowledge representation in the VKB. Arterial terms are shown in red, venous terms in blue. In this diagram, an organ region that is supplied or drained by arteries or veins respectively is labeled as “Microcirculation” and shown in green. Two key relations (depicted as edges) are shown: (i) the has_branch (gray) that associates a parent vessel with its branches—the dotted gray line indicates that only a subset of the branches of a parent vessel is shown, and (ii) the supplies (pink) relation indicates the provision and drainage of blood between organ microcirculations and connected large vessels.
Figure 3
Figure 3
A screenshot from the ApiNATOMY circuitboard user interface, showing an example of cellular spatial distribution in a pFTU derived from the human colon. Overlay of red edges represents arterial connections, and venous connections are in blue.
Figure 4
Figure 4
Illustrating the application of templates to acquire 3D spatial pFTU data from a block of epithelial tissue (e.g., pancreas)—the schematic view of a 2D section through this block is illustrated here. [A] Red, capillary vessels; [B] Yellow, epithelial conduits (e.g., pancreatic acinar ducts); [S], Endothelial pFTU; [T] Epithelial pFTU.
Figure 5
Figure 5
Image processing sequence to generate the pFTU domains. External processing with Woolz is required for 3D domain dilation and pFTU modeling: (A) Fiji-TrakEM2 window showing primary capillary and colonic crypt delineation; (B) 3D domains for the capillaries and crypt lumens; (C) pFTU regions for one of the colonic crypts; (D) 2D section view showing the pFTU regions superimposed on the histology and illustrating spatial overlap of pFTUs of different type (i.e., in this case, endothelial and epithelial).
Figure 6
Figure 6
Screenshot of GUI for the 3D reconstruction of pFTU- and PTM-annotated human colonic mucosa. Viewer controls allow arbitrary re-sectioning through the reconstructed volume, shown here with overlaid domains associated with 3 capillaries (left to right: painted blue, red and green) and their associated pFTUs (left to right: painted turqoise, purple and orange). The leftmost domain also shows CT cell annotation. The viewer shows how, in general, cells can be members of multiple pFTUs. The viewer is available at Cardona et al. (2012).
Figure 7
Figure 7
Illustrative example of the interaction between ApiNATOMY, PMR web services, and the GMS to generate the GUI output shown in Figure 8. Using the SPARQL endpoint provided by the RICORDO services implemented in PMR, ApiNATOMY is able to execute SPARQL queries using the PMR metadata repository [arrow 1, in bold]. In the example shown, ApiNATOMY is querying for a given FMA term (for the renal proximal tubule) and a specific paper identified via a PubMed ID. PMR responds to the query providing all matching PMR exposures [arrow 2], from which the ApiNATOMY user selects the appropriate PMR workspace (identified by the URL shown in the diagram). From the selected workspace, the ApiNATOMY user selects a specific CellML model (or the tool infers the required CellML model from information obtained from the exposure definition in PMR) and the GMS is instructed to load that CellML model [arrow 3]. Upon receiving this instruction, the GMS will request the model from PMR (Petersen et al., 2014) and instantiate that model into an internal executable form (de Bono et al., 2013). ApiNATOMY is able to sample spatial fields (Hunter and de Bono, 2014) to extract temporal snapshots for a specific spatial location. Using services provided by the GMS, ApiNATOMY is able to select a particular variables in the instantiated CellML model (Smith et al., ; Rosse and Mejino, 2003) and instruct the GMS to use the temporal snapshot to define that variable (Smith et al., 2007). This service requires the transfer of the temporal snapshot from ApiNATOMY to the GMS using a standard JavaScript array encoded as a JSON string, . Once a particular simulation is fully defined, ApiNATOMY instructs the GMS to execute the simulation (Hunter et al., 2013), over the time interval specified by the central timing module. Following the execution of the simulation, ApiNATOMY requests the simulated variable transient(s) for the desired model variables (Rosse and Mejino, 2003) and presents the results to the user. Once again, this data is transferred as JavaScript arrays encoded in the JSON format.
Figure 8
Figure 8
Screenshot of an ApiNATOMY GUI displaying time-varying cyclical changes in blood pressure [v] and flow [u] in the kidney microcirculation. The arterial (red) and venous (blue) vascular routes connecting the heart to the kidney is also overlaid onto the circuitboard. A red box glyph representing RICORDO semantic metadata annotation is located in the Right Kidney tile (i.e., the location of the glyph represents the annotation of the model variable to the Right Kidney term in the FMA), and a number of glyphs are overlaid on the blood-vessel representations connecting the Right Upper Urinary Tract to the Heart. These glyphs are rendered on an SVG layer (scalable vector graphics), and each represents a specific variable. Clicking on them brings up a graph plotting that variable over time. The time dimension can be manipulated and traversed with the slider at the bottom.
Figure 9
Figure 9
A schematic illustrating the Open Physiology modeling workflow (Right: steps A–F). On the left of the diagram, the relationships between the key resources relevant to this workflow are also shown. An example of a topological map is the Vascular KnowledgeBase (VKB) referred to in the section titled “Developing and Managing Knowledge About Routes of Flow”. The term PTM stands for Primary Tissue Motif, discussed in the section titled “Applying Histology Templates to Acquire pFTU Knowledge”. The RICORDO tool manages the mapping between semantic metadata and ontology-based knowledge (i.e., the double-headed red arrows). ApiNATOMY automatically generates (i) treemaps out of ontology-based knowledge, and overlays (ii) edges from topological maps to create a circuitboard. Glyphs representing semantic metadata in RICORDO are then graphically overlaid onto the circuitboard.

References

    1. Bard J., Rhee S. Y., Ashburner M. (2005). An ontology for cell types. Genome Biol. 6:R21. 10.1186/gb-2005-6-2-r21 - DOI - PMC - PubMed
    1. Bradley C., Bowery A., Britten R., Budelmann V., Camara O., Christie R., et al. . (2011). OpenCMISS: a multi-physics & multi-scale computational infrastructure for the VPH/Physiome project. Prog. Biophys. Mol. Biol. 107, 32–47. 10.1016/j.pbiomolbio.2011.06.015 - DOI - PubMed
    1. Cardona A., Saalfeld S., Schindelin J., Arganda-Carreras I., Preibisch S., Longair M., et al. . (2012). TrakEM2 software for neural circuit reconstruction. PLoS ONE. 7:e38011. 10.1371/journal.pone.0038011 - DOI - PMC - PubMed
    1. Chelliah V., Laibe C., Le Novère N. (2013). BioModels Database: a repository of mathematical models of biological processes. Methods Mol. Biol. 1021, 189–199. 10.1007/978-1-62703-450-0_10 - DOI - PubMed
    1. Cooling M. T., Hunter P., Crampin E. J. (2008). Modelling biological modularity with CellML. IET Syst. Biol. 2, 73–79. 10.1049/iet-syb:20070020 - DOI - PubMed