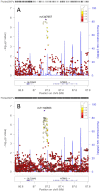
First genome-wide association study in an Australian aboriginal population provides insights into genetic risk factors for body mass index and type 2 diabetes
- PMID: 25760438
- PMCID: PMC4356593
- DOI: 10.1371/journal.pone.0119333
First genome-wide association study in an Australian aboriginal population provides insights into genetic risk factors for body mass index and type 2 diabetes
Abstract
A body mass index (BMI) >22kg/m2 is a risk factor for type 2 diabetes (T2D) in Aboriginal Australians. To identify loci associated with BMI and T2D we undertook a genome-wide association study using 1,075,436 quality-controlled single nucleotide polymorphisms (SNPs) genotyped (Illumina 2.5M Duo Beadchip) in 402 individuals in extended pedigrees from a Western Australian Aboriginal community. Imputation using the thousand genomes (1000G) reference panel extended the analysis to 6,724,284 post quality-control autosomal SNPs. No associations achieved genome-wide significance, commonly accepted as P<5x10⁻⁸. Nevertheless, genes/pathways in common with other ethnicities were identified despite the arrival of Aboriginal people in Australia >45,000 years ago. The top hit (rs10868204 Pgenotyped = 1.50x10⁻⁶; rs11140653 Pimputed_1000G = 2.90x10⁻⁷) for BMI lies 5' of NTRK2, the type 2 neurotrophic tyrosine kinase receptor for brain-derived neurotrophic factor (BDNF) that regulates energy balance downstream of melanocortin-4 receptor (MC4R). PIK3C2G (rs12816270 Pgenotyped = 8.06x10⁻⁶; rs10841048 Pimputed_1000G = 6.28x10⁻⁷) was associated with BMI, but not with T2D as reported elsewhere. BMI also associated with CNTNAP2 (rs6960319 Pgenotyped = 4.65x10⁻⁵; rs13225016 Pimputed_1000G = 6.57x10⁻⁵), previously identified as the strongest gene-by-environment interaction for BMI in African-Americans. The top hit (rs11240074 Pgenotyped = 5.59x10⁻⁶, Pimputed_1000G = 5.73x10⁻⁶) for T2D lies 5' of BCL9 that, along with TCF7L2, promotes beta-catenin's transcriptional activity in the WNT signaling pathway. Additional hits occurred in genes affecting pancreatic (KCNJ6, KCNA1) and/or GABA (GABRR1, KCNA1) functions. Notable associations observed for genes previously identified at genome-wide significance in other populations included MC4R (Pgenotyped = 4.49x10⁻⁴) for BMI and IGF2BP2 Pimputed_1000G = 2.55x10⁻⁶) for T2D. Our results may provide novel functional leads in understanding disease pathogenesis in this Australian Aboriginal population.
Conflict of interest statement
Figures


Similar articles
-
A Genome-wide Association Study Identifies SERPINB10, CRLF3, STX7, LAMP3, IFNG-AS1, and KRT80 As Risk Loci Contributing to Cutaneous Leishmaniasis in Brazil.Clin Infect Dis. 2021 May 18;72(10):e515-e525. doi: 10.1093/cid/ciaa1230. Clin Infect Dis. 2021. PMID: 32830257 Free PMC article.
-
Impact of nine common type 2 diabetes risk polymorphisms in Asian Indian Sikhs: PPARG2 (Pro12Ala), IGF2BP2, TCF7L2 and FTO variants confer a significant risk.BMC Med Genet. 2008 Jul 3;9:59. doi: 10.1186/1471-2350-9-59. BMC Med Genet. 2008. PMID: 18598350 Free PMC article.
-
Use of net reclassification improvement (NRI) method confirms the utility of combined genetic risk score to predict type 2 diabetes.PLoS One. 2013 Dec 20;8(12):e83093. doi: 10.1371/journal.pone.0083093. eCollection 2013. PLoS One. 2013. PMID: 24376643 Free PMC article.
-
Replication and Relevance of Multiple Susceptibility Loci Discovered from Genome Wide Association Studies for Type 2 Diabetes in an Indian Population.PLoS One. 2016 Jun 16;11(6):e0157364. doi: 10.1371/journal.pone.0157364. eCollection 2016. PLoS One. 2016. PMID: 27310578 Free PMC article.
-
Evaluation of genome-wide association study-identified type 2 diabetes loci in African Americans.Am J Epidemiol. 2012 Dec 1;176(11):995-1001. doi: 10.1093/aje/kws176. Epub 2012 Nov 9. Am J Epidemiol. 2012. PMID: 23144361 Free PMC article.
Cited by
-
Genetic variation in the body mass index of adult survivors of childhood acute lymphoblastic leukemia: A report from the Childhood Cancer Survivor Study and the St. Jude Lifetime Cohort.Cancer. 2021 Jan 15;127(2):310-318. doi: 10.1002/cncr.33258. Epub 2020 Oct 13. Cancer. 2021. PMID: 33048379 Free PMC article.
-
Genetics of type 2 diabetes mellitus in Indian and Global Population: A Review.Egypt J Med Hum Genet. 2022;23(1):135. doi: 10.1186/s43042-022-00346-1. Epub 2022 Sep 2. Egypt J Med Hum Genet. 2022. PMID: 37192883 Free PMC article. Review.
-
Association of gene coding variation and resting metabolic rate in a multi-ethnic sample of children and adults.BMC Obes. 2017 Apr 5;4:12. doi: 10.1186/s40608-017-0145-5. eCollection 2017. BMC Obes. 2017. PMID: 28417008 Free PMC article.
-
Common and Rare Genetic Variants That Could Contribute to Severe Otitis Media in an Australian Aboriginal Population.Clin Infect Dis. 2021 Nov 16;73(10):1860-1870. doi: 10.1093/cid/ciab216. Clin Infect Dis. 2021. PMID: 33693626 Free PMC article.
-
Mortality in a cohort of remote-living Aboriginal Australians and associated factors.PLoS One. 2018 Apr 5;13(4):e0195030. doi: 10.1371/journal.pone.0195030. eCollection 2018. PLoS One. 2018. PMID: 29621272 Free PMC article.
References
-
- Donnelly P. Genome-sequencing anniversary. Making sense of the data. Science. 2011;331(6020):1024–5. doi: 331/6020/1024-c[pii]10.1126/science.1204089 - PubMed
-
- Fesinmeyer MD, North KE, Lim U, Buzkova P, Crawford DC, Haessler J, et al. Effects of smoking on the genetic risk of obesity: the population architecture using genomics and epidemiology study. BMC Med Genet. 2013;14:6 doi: 10.1186/1471-2350-14-6 1471-2350-14-6[pii] - DOI - PMC - PubMed
-
- McCarthy MI. Genomics, type 2 diabetes, and obesity. N Engl J Med. 2010;363(24):2339–50. doi: 10.1056/NEJMra0906948 - DOI - PubMed
-
- Morris AP, Voight BF, Teslovich TM, Ferreira T, Segre AV, Steinthorsdottir V, et al. Large-scale association analysis provides insights into the genetic architecture and pathophysiology of type 2 diabetes. Nat Genet. 2012;44(9):981–90. doi: ng.2383 [pii] 10.1038/ng.2383 - PMC - PubMed
-
- Scott RA, Lagou V, Welch RP, Wheeler E, Montasser ME, Luan J, et al. Large-scale association analyses identify new loci influencing glycemic traits and provide insight into the underlying biological pathways. Nat Genet. 2012;44(9):991–1005. doi: ng.2385 [pii] 10.1038/ng.2385 - PMC - PubMed
Publication types
MeSH terms
Grants and funding
LinkOut - more resources
Full Text Sources
Other Literature Sources
Medical
Molecular Biology Databases

