. 2015 Mar 11;10(3):e0118753.
doi: 10.1371/journal.pone.0118753. eCollection 2015.

Combined EEG/MEG can outperform single modality EEG or MEG source reconstruction in presurgical epilepsy diagnosis

Affiliations

Combined EEG/MEG can outperform single modality EEG or MEG source reconstruction in presurgical epilepsy diagnosis

Ümit Aydin et al. PLoS One. .

Abstract

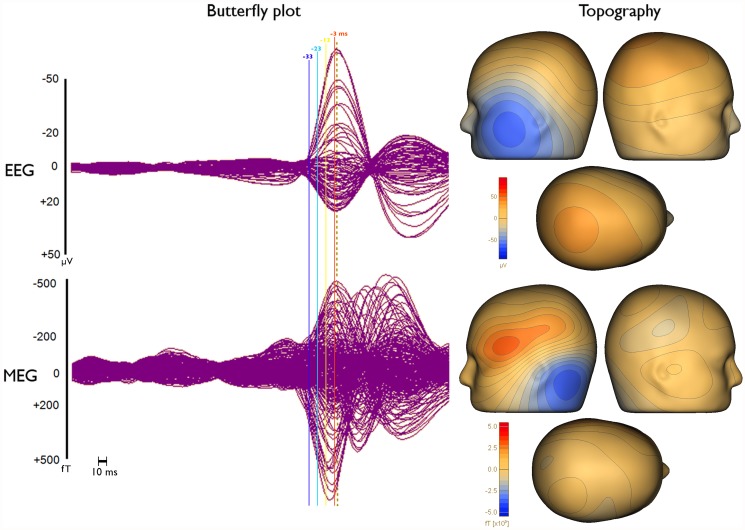
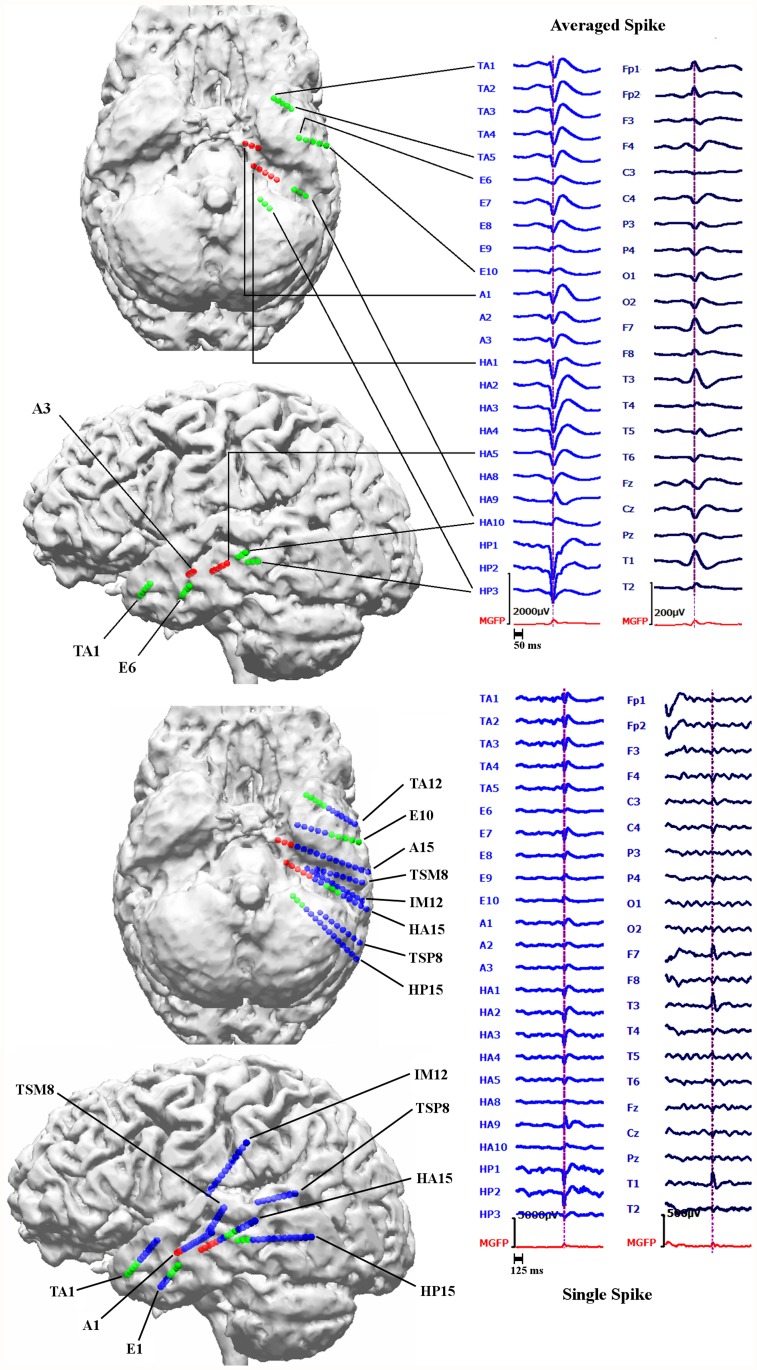
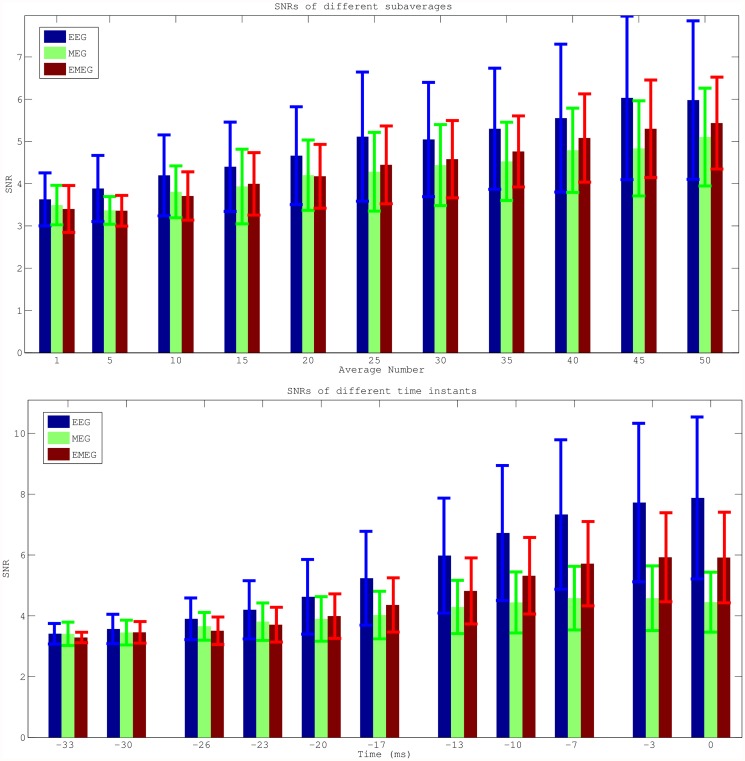
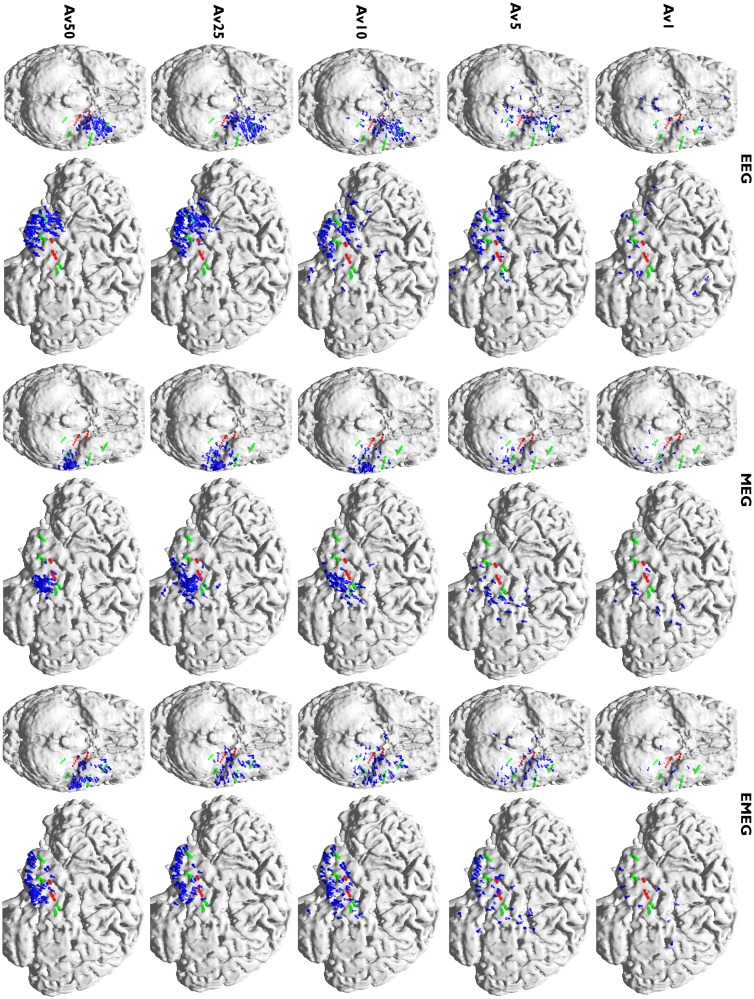
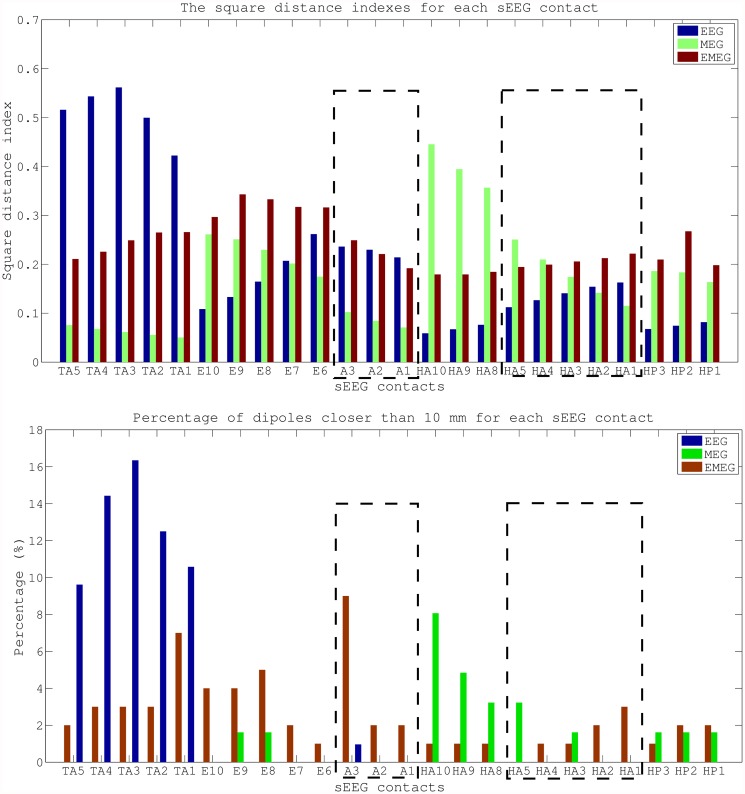
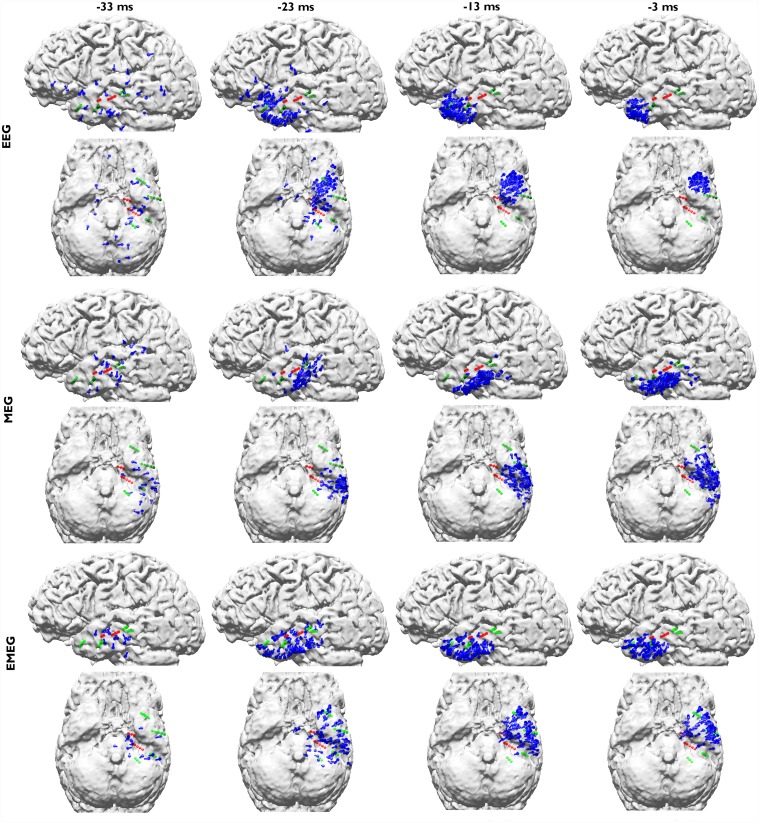
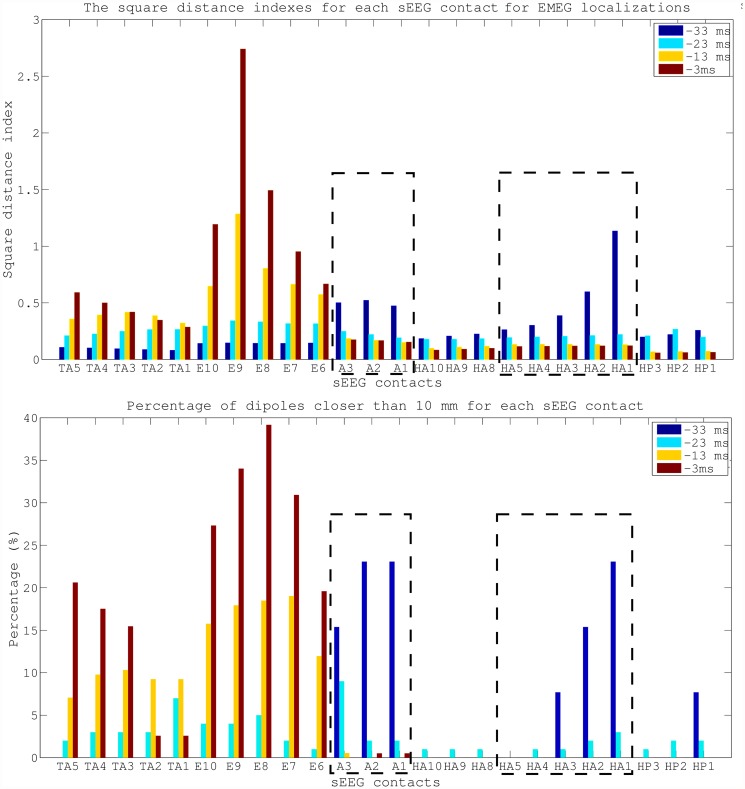
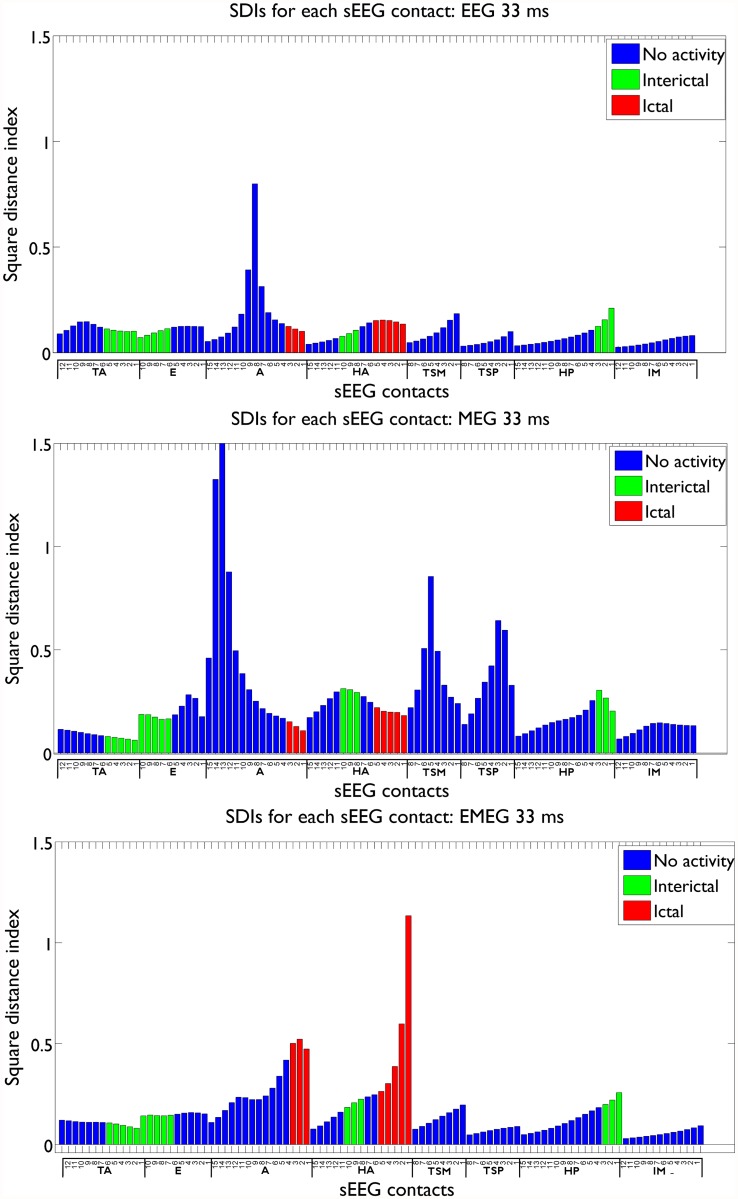
We investigated two important means for improving source reconstruction in presurgical epilepsy diagnosis. The first investigation is about the optimal choice of the number of epileptic spikes in averaging to (1) sufficiently reduce the noise bias for an accurate determination of the center of gravity of the epileptic activity and (2) still get an estimation of the extent of the irritative zone. The second study focuses on the differences in single modality EEG (80-electrodes) or MEG (275-gradiometers) and especially on the benefits of combined EEG/MEG (EMEG) source analysis. Both investigations were validated with simultaneous stereo-EEG (sEEG) (167-contacts) and low-density EEG (ldEEG) (21-electrodes). To account for the different sensitivity profiles of EEG and MEG, we constructed a six-compartment finite element head model with anisotropic white matter conductivity, and calibrated the skull conductivity via somatosensory evoked responses. Our results show that, unlike single modality EEG or MEG, combined EMEG uses the complementary information of both modalities and thereby allows accurate source reconstructions also at early instants in time (epileptic spike onset), i.e., time points with low SNR, which are not yet subject to propagation and thus supposed to be closer to the origin of the epileptic activity. EMEG is furthermore able to reveal the propagation pathway at later time points in agreement with sEEG, while EEG or MEG alone reconstructed only parts of it. Subaveraging provides important and accurate information about both the center of gravity and the extent of the epileptogenic tissue that neither single nor grand-averaged spike localizations can supply.


Conflict of interest statement

Competing Interests: The authors have declared that no competing interests exist.

Figures

Fig 1
Fig 1. Butterfly plots and topographies of grand-average EEG and MEG spikes.
Butterfly plots (left) and topographies (right) of EEG (upper row) and MEG (lower row) for the grand-average (average over all 200 single epileptic spikes). The time points that are discussed in the manuscript, namely -33 ms (dark blue), -23 ms (light blue), -13 ms (yellow) and -3 ms (orange), are indicated by solid vertical lines with different colors. Topographies are shown for the EEG spike peak (time point 0 ms) as indicated by the dashed vertical line in the butterfly plots.
Fig 2
Fig 2. Locations of sEEG contacts inside the brain and epileptic activity measured with sEEG and ldEEG.
Examples for an averaged (top right block) and a single epileptic spike (bottom right block) measured simultaneously with sEEG (left column in each block) and 21 electrodes low density scalp EEG (ldEEG) (right column in each block). Maximum of sEEG is at the HP2 contact as shown by the vertical lines at the peak of this contact. In the upper two brain figures (left block) only the active (that measures interictal or ictal signals) sEEG contacts are indicated while the bottom two indicate the positions of both active and not active sEEG contacts close to the left temporal lobe. The union of green and red spheres shows the sEEG contacts measuring frequent interictal activity, red spheres alone show the contacts measuring seizure onset and blue contacts do not measure interictal or seizure activity.
Fig 3
Fig 3. Mean SNRs for EEG, MEG and EMEG for different subaverages and different phases.
Average SNRs (with error bars indicating the standard deviations) for EEG (blue), MEG (green) and EMEG (red). Only single epileptic spikes (Av1) or subaverages (Av5-Av50) with SNRs higher than three have been taken into account in these figures. The upper row shows the results for different average numbers for time point-23 ms at the rising flank of the averaged epileptic spike and the lower row for different time points from -33ms (spike onset) to 0ms (spike peak in EEG) for subaverage 10 (Av10).
Fig 4
Fig 4. Centroid dipoles of EEG, MEG and EMEG for different subaverages at -23 ms.
Centroid dipoles determined from the dipole scan peaks of EEG (upper row), MEG (middle row) and EMEG (lower row) for different subaverages at 23 ms before the EEG spike peak. Each color shows centroids for different subaverages and Av1 is the centroid for single spike reconstructions. The centroid dipoles were computed from those random realizations out of 200 random realizations for each group, which satisfied the SNR>3 criterion.
Fig 5
Fig 5. Peaks of the deviation scans of EEG, MEG and EMEG for different subaverages.
Peaks of the deviation scans (illustrated by blue dipoles) of EEG (left two columns), MEG (middle two columns) and EMEG (right two columns) for different subaverages. The figure shows the results at 23 ms before the peak of the EEG. Both green and red spheres show the sEEG contacts where frequent interictal activity can be measured, thus giving an impression of the minimal size of the irritative zone, and red spheres alone show seizure onset contacts.
Fig 6
Fig 6. Quantitative comparison of EEG, MEG and EMEG source reconstructions and sEEG contacts.
Square distance index and the percentage of dipoles closer than 10 mm for each sEEG contact. The values are given for EEG, MEG and EMEG for subaverages of 10 at -23 ms. The sEEG contacts enclosed by dashed lines are within the seizure onset zone.
Fig 7
Fig 7. EEG, MEG and EMEG deviation scan peaks of Av10 at different propagation phases.
EEG (upper two rows), MEG (middle two rows) and EMEG (lower two rows) deviation scan peaks (illustrated by blue dipoles) of Av10 for time points -33 ms (spike onset, left column) in steps of 10 ms until time point -3 ms (late propagation phase close to EEG peak, right column). Both green and red spheres show the sEEG contacts where frequent interictal activity can be measured, thus giving an impression of the minimal size of the irritative zone, and red spheres alone show seizure onset contacts.
Fig 8
Fig 8. Quantitative comparison of EMEG source reconstructions and sEEG contacts at different propagation phases.
Square distance indexes and the percentage of dipoles closer than 10 mm for each sEEG contact. The values are given for Av10 EMEG subaverages at -33, -23, -13 and -3 ms. The sEEG contacts enclosed by dashed lines were within the seizure onset zone.
Fig 9
Fig 9. SDI values for EEG, MEG and EMEG at -33 ms.
The SDI bars are colored according to the measured activity: seizure onset contacts (red), only interictal contacts (green) and not active contacts (blue).

References

    1. Agirre-Arrizubieta Z, Thai NJ, Valentín A, Furlong PL, Seri S, Selway RP, et al. (2014): The value of Magnetoencephalography to guide electrode implantation in epilepsy. Brain Topogr. 27(1):197–207. 10.1007/s10548-013-0330-x - DOI - PubMed
    1. Bast T, Boppel T, Rupp A, Harting I, Hoechstetter K, Fauser S, et al. (2006): Noninvasive source localization of interictal EEG spikes: effects of signal-to-noise ratio and averaging. J. Clin. Neurophysiol. 23(6):487–97. - PubMed
    1. Boon P, D’Have M, Vanrumste B, van Hoey G, Vonck K, van Walleghem P, et al. (2002): Ictal source localization in presurgical patients with refractory epilepsy. J. Clin. Neurophysiol. 19(5):461–8. - PubMed
    1. Ebersole JS (1999): Non-invasive pre-surgical evaluation with EEG/MEG source analysis. Electroencephalogr. Clin. Neurophysiol. 50:167–74. - PubMed
    1. Fischer MJ, Scheler G, Stefan H (2005): Utilization of magnetoencephalography results to obtain favourable outcomes in epilepsy surgery. Brain 128:153–7. - PubMed

Publication types