. 2015 Mar 11;10(3):e0118765.
doi: 10.1371/journal.pone.0118765. eCollection 2015.

Enhanced neuronal glucose transporter expression reveals metabolic choice in a HD Drosophila model

Affiliations

Enhanced neuronal glucose transporter expression reveals metabolic choice in a HD Drosophila model

Marie Thérèse Besson et al. PLoS One. .

Abstract

Huntington's disease is a neurodegenerative disorder caused by toxic insertions of polyglutamine residues in the Huntingtin protein and characterized by progressive deterioration of cognitive and motor functions. Altered brain glucose metabolism has long been suggested and a possible link has been proposed in HD. However, the precise function of glucose transporters was not yet determined. Here, we report the effects of the specifically-neuronal human glucose transporter expression in neurons of a Drosophila model carrying the exon 1 of the human huntingtin gene with 93 glutamine repeats (HQ93). We demonstrated that overexpression of the human glucose transporter in neurons ameliorated significantly the status of HD flies by increasing their lifespan, reducing their locomotor deficits and rescuing eye neurodegeneration. Then, we investigated whether increasing the major pathways of glucose catabolism, glycolysis and pentose-phosphate pathway (PPP) impacts HD. To mimic increased glycolytic flux, we overexpressed phosphofructokinase (PFK) which catalyzes an irreversible step in glycolysis. Overexpression of PFK did not affect HQ93 fly survival, but protected from photoreceptor loss. Overexpression of glucose-6-phosphate dehydrogenase (G6PD), the key enzyme of the PPP, extended significantly the lifespan of HD flies and rescued eye neurodegeneration. Since G6PD is able to synthesize NADPH involved in cell survival by maintenance of the redox state, we showed that tolerance to experimental oxidative stress was enhanced in flies co-expressing HQ93 and G6PD. Additionally overexpressions of hGluT3, G6PD or PFK were able to circumvent mitochondrial deficits induced by specific silencing of genes necessary for mitochondrial homeostasis. Our study confirms the involvement of bioenergetic deficits in HD course; they can be rescued by specific expression of a glucose transporter in neurons. Finally, the PPP and, to a lesser extent, the glycolysis seem to mediate the hGluT3 protective effects, whereas, in addition, the PPP provides increased protection to oxidative stress.


Conflict of interest statement

Competing Interests: The authors have declared that no competing interests exist.

Figures

Fig 1
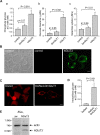
Fig 1. Expression and functional characterization of DmGluT1 and hGluT3.
(A): Measurements of uptake parameters. HEK 293 cells were transfected with the glucose sensor and either an empty (control), DmGluT1, or hGluT3 plasmids. Only hGluT3 expression resulted in very significant increases in intracellular glucose concentration at 5mM extracellular glucose (a), glucose clearance (b) and galactose uptake (c). (B): hGluT3 immunodetection: HEK-293 cells transfected with the empty plasmid were not labelled, with the hGluT3 antibody (middle panel) whereas hGluT3-transfected cells revealed plasma membrane localization (right panel). The left panel shows hGluT3-transfected cells in bright field. Scale bar: 5 μm. (C): Detection of the DsRed-DmGluT1 (right panel) showing its localization at the plasma membrane; The left panel shows DsRed-transfected cells as control. Scale bar: 5 μm. (D): Exposure of DsRed-DmGlut1 cells to 25 mM extracellular glucose resulted in significantly higher intracellular glucose relative to control cells. (E): Detection of hGluT3 and actin mRNA in flies expressing no transgene or hGluT3 under the control of the Elav-Gal4 driver. RT-PCR analysis was performed from Drosophila heads at 4 days of adult age.
Fig 2
Fig 2. Overexpression of hGluT3 in neurons with HQ93 increases survival, rescues locomotor performance and neurodegeneration.
(A): Typical survival curve of flies expressing the neuronal driver Elav-Gal4 and HQ93 (filled triangles) or HQ93 and hGluT3 (open circles) with n = 237 and 80 flies respectively. The log-rank test indicates that the two survival curves were very different (***; p<0.0001). (B): Locomotor performance evaluated by negative geotaxis test on 12 day-old flies expressing the indicated transgenes under the neuronal Elav-Gal4 driver. Open columns indicate the percentages of flies remaining at the bottom of the column; filled columns indicate the percentages of flies climbing to the top. Results were the means + SEM of the percentages obtained from a representative experiment (n = 55; 54 flies respectively for each genotype). Comparisons were performed by Student’s t-test (*, p = 0.0239). (C): Representative deep pseudopupil photomicrographs of eyes from 4-day old flies expressing no transgene (control), HQ93 alone, or HQ93 and hGluT3 under the control of Elav-Gal4. (D): Photoreceptor frequency distributions in 1- or 4-day old flies expressing HQ93 alone, or HQ93 and hGluT3. Statistical significance testing the median value of photoreceptor number per ommatidium was determined by Mann-Whitney test (one-tailed) (p<0.001).
Fig 3
Fig 3. Effect of PFK overexpression on the phenotype of HQ93 flies.
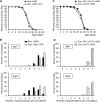
(A): Lifespans of flies expressing the transgenes PFK and HQ93 (open diamonds) or only HQ93 (filled triangles) were not different as tested by log-rank test. In this representative experiment, 120 and 61 flies respectively were used. (B): Photoreceptor frequency distributions in 1- or 4-day old fly ommatidia expressing HQ93 alone (black bars), or PFK and HQ93 (grey bars) under the control of Elav-Gal4. Statistical significances on median values of photoreceptor numbers per ommatidium were determined by one-tailed Mann-Whitney test (at day 1, p = 0.0033.; at day 4, p< 0.0001). (C): The lifespan of flies expressing HQ93 together with PFK and hGluT3 (filled circles) was not statistically different from that of flies expressing HQ93 and hGluT3 (open circles); in the experiment, 219 and 181 flies were used. (D): Photoreceptor frequency distributions in 1- or 4-day old fly ommatidia expressing HQ93 together with PFK and hGluT3 (white bars), or HQ93 and hGluT3 (grey bars) under the control of Elav-Gal4. The one-tailed Mann-Whitney test indicates no statistical significances between the two fly lines neither at day 1 nor at day 4.
Fig 4
Fig 4. Effect of overexpression of G6PD on the phenotype of HQ93 flies.
(A): Lifespan of flies carrying two neuronal transgenes G6PD and HQ93 (open circles) was extended in comparison with flies carrying only HQ93 (filled triangles) with Elav-Gal4, n = 102 and 126 flies respectively. Survival curves were highly significantly different by log-rank test (***, p<0.0001). (B): Photoreceptor frequency distributions in 1- or 4-day old flies expressing HQ93 alone (black bars), or G6PD and HQ93 (grey bars). The median value of photoreceptor number per ommatidium between the two lines was statistically significant at the 1st and 4th day after adult emergence (Mann-Whitney test; at day 1, p = 0.0104; at day 4, p< 0.0003). (C): Lifespan of HQ93 flies carrying hGluT3 and G6PD (filled diamonds) was not different from the lifespan of HQ93 flies carrying only hGluT3 (open diamonds) with Elav-Gal4, n = 117 and 181 flies respectively.
Fig 5
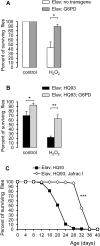
Fig 5. G6PD and JafracI ameliorate oxidative stress tolerance of HD flies.
(A): Representative survival rate of 12 day-old flies expressing no transgene (white bar) or G6PD (grey bar) after 48 hr exposure to 2% sucrose or to 1.5% H2O2 in 2% sucrose. Numbers of flies included in this assay were respectively: 40; 19; 99; 74. Results represented the means + SEM of the percentages obtained from a representative experiment. The Mann-Whitney test indicates a significant difference between the two genotypes for H2O2-exposed flies (*, p = 0.016). (B): Representative survival rate of 12 day-old flies expressing HQ93 (black bar), or co-expressing HQ93 and G6PD (grey bar) after 48 hr exposure to 2% sucrose or to 1.5% H2O2 in 2% sucrose. Numbers of flies included in this assay were 36; 56; 93; 85 respectively. Results represented the means + SEM of the percentages obtained from a representative experiment. The Mann-Whitney test indicates a significant difference between the two genotypes for non-treated flies (*, p = 0.041) and for H2O2-exposed flies (**, p = 0.006). (C): The survival curve of flies expressing HQ93 as control (squares) or HQ93 and Jafrac I (diamonds) under the neuronal driver Elav-Gal4, with n = 100 and 159 flies respectively. The log-rank test indicates that the two survival curves were very different (***, p<0.0001).
Fig 6
Fig 6. Survivals of flies overexpressing hGluT3 or G6PD or PFK with mitochondrial dysfunctions in neurons.
(A): RT-qPCR assays for E1-PDH and ND23 transcripts showing reduced levels of each transcript in flies expressing the RNAi under the Elav-Gal4 driver. Transcripts levels (filled bars) were expressed in percent relative to controls (no transgene; open bars). They represent the means + SEM of at least 3 separate experiments prepared from heads at the first day of adult age. The one-tailed Mann-Whitney test indicates a difference in mRNA levels between the RNAi-induced and control genotypes (**, p = 0.0076 for E1-PDH; **, p = 0.0083 for ND23). (B, C, D): Survival curves of flies expressing each mitochondria-targeting RNAi alone or together with either hGluT3, G6PD or PFK in the respective figure under the control of Elav-Gal4. Only the first fourty days of the lifespan were presented. The survival curves of flies expressing only the RNAis specifically-targeted to E1-PDH (filled squares; n = 51) and ND23 subunits (filled triangles; n = 53) were in common for the figures B, C and D. The survival for control flies (Elav; hGluT3 or Elav; G6PD or Elav; PFK) was indicated by open circles in each corresponding graph (n = 75; 81; 131, respectively). In each figure, the log-rank test indicates a p-value <0.0001 (***) between the survival curves of the flies overexpressing hGluT3 or G6PD or PFK and the RNAi and the survival curves of the flies expressing each RNAi only. (B): Survival curves of flies expressing the RNAis or co-expressing each respective RNAi and hGluT3 (open symbols; n = 84 and 73) under Elav-Gal4. (C): Survival curve of flies expressing the RNAis or co-expressing each respective RNAi and G6PD (open symbols; n = 84 and 60 respectively) under Elav-Gal4. (D): Survival curve of flies expressing the RNAis or co-expressing each respective RNAi and PFK (open symbols; n = 79 and 111 respectively) under Elav-Gal4.

References

    1. Jeong SJ, Kim M, Chang KA, Kim HS, Park CH, Suh YH. Huntingtin is localized in the nucleus during preimplanatation embryo development in mice. Int J Dev Neurosci. 2006; 24: 81–85. - PubMed
    1. Sinadinos C, Burbidge-King T, Soh D, Thompson LM, Marsh JL, Wyttenbach A, et al. Live axonal transport disruption by mutant huntingtin fragments in Drosophila motor neuron axons. Neurobiol Dis. 2009; 34: 389–395. 10.1016/j.nbd.2009.02.012 - DOI - PubMed
    1. Benn CL, Sun T, Sadri-Vakili G, McFarland KN, DiRocco DP, Yohrling GJ, et al. Huntingtin modulates transcription, occupies gene promoters in vivo, and binds directly to DNA in a polyglutamine-dependent manner. J Neurosci. 2008; 28: 10720–10733. 10.1523/JNEUROSCI.2126-08.2008 - DOI - PMC - PubMed
    1. Moumne L, Betuing S, Caboche J. Multiple aspects of gene dysregulation in Huntington's disease. Front Neurol. 2013; 4: 127 10.3389/fneur.2013.00127 - DOI - PMC - PubMed
    1. Smith R, Bacos K, Fedele V, Soulet D, Walz HA, Obermüller S, et al. Mutant huntingtin interacts with {beta}-tubulin and disrupts vesicular transport and insulin secretion. Hum Mol Genet. 2009; 18: 3942–3954. 10.1093/hmg/ddp336 - DOI - PubMed

Publication types

MeSH terms