. 2015 Feb 6;15(2):10.
doi: 10.1167/15.2.10.

Salience of unique hues and implications for color theory

Affiliations

Salience of unique hues and implications for color theory

Lauren E Wool et al. J Vis. .

Abstract

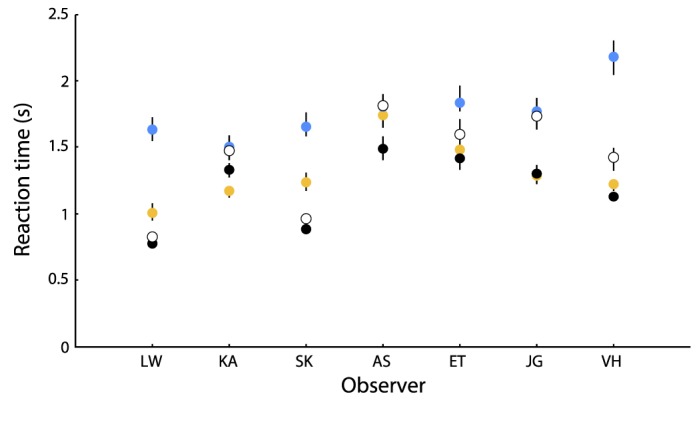
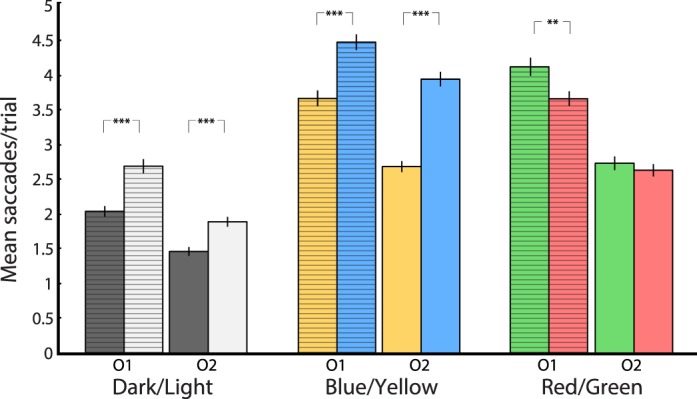
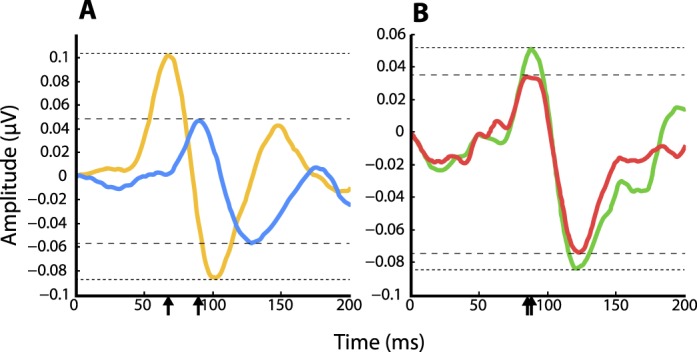
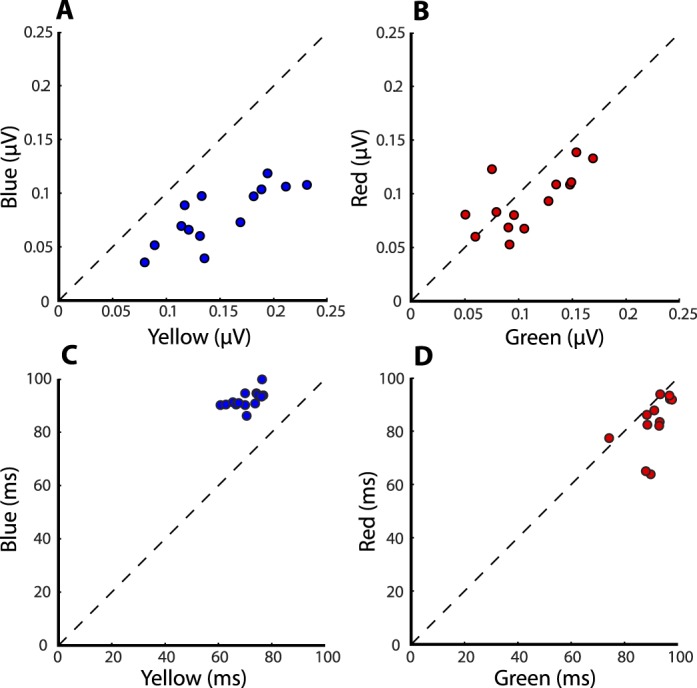
The unique hues--blue, green, yellow, red--form the fundamental dimensions of opponent-color theories, are considered universal across languages, and provide useful mental representations for structuring color percepts. However, there is no neural evidence for them from neurophysiology or low-level psychophysics. Tapping a higher prelinguistic perceptual level, we tested whether unique hues are particularly salient in search tasks. We found no advantage for unique hues over their nonunique complementary colors. However, yellowish targets were detected faster, more accurately, and with fewer saccades than their complementary bluish targets (including unique blue), while reddish-greenish pairs were not significantly different in salience. Similarly, local field potentials in primate V1 exhibited larger amplitudes and shorter latencies for yellowish versus bluish stimuli, whereas this effect was weaker for reddish versus greenish stimuli. Consequently, color salience is affected more by early neural response asymmetries than by any possible mental or neural representation of unique hues.

Keywords: color electrophysiology; color perception; color psychophysics; response asymmetry; salience; unique hues; visual search.


Figures

Figure 1
Figure 1
Stimulus color space. Observers were instructed to select four unique hues: a red and green that were neither bluish nor yellowish, and a blue and yellow that were neither reddish nor greenish. (A) Hues were selected by navigating a gradated patch of hues with a keyboard. (B) Candidate hues fell along a circle around neutral white in the isoluminant plane of cardinal color space; numbers indicate the cone coordinates (L, M, S) at axis extrema. Unique hues for seven observers are shown: red (▽), blue (□), green (○), and yellow (⋄).
Figure 2
Figure 2
Subitizing-search task. After a 7-s fixation screen, each pairwise color condition was displayed in blocks of 36 trials, each trial consisting of 1, 2, or 3 targets in either color presented randomly on binary color noise. New trials were initiated by observer input into a number pad. Condition blocks (n = 6) were randomly interleaved, with each repeated a total of six times over the course of one session. Observers sat for a total of three sessions after a training session. An example series of trials for the cardinal red-green (top) and blue-yellow (bottom) conditions are shown. Dashed lines are illustrative and were not present during the task.
Figure 3
Figure 3
Reaction-time data for observer ET. Ex-Gaussian functions fitted to RT data plotted cumulatively for each of six color conditions: (A) cardinal blue (DB) and cardinal yellow (DY), (B) unique blue (UB) and complementary yellow (CY), (C) unique yellow (UY) and complementary blue (CB), (D) cardinal red (DR) and cardinal green (DG), (E) unique red (UR) and complementary green (CR), and (F) unique green (UR) and complementary red (CR). Inset p-values are the results of Kolmogorov-Smirnov (K–S) tests for significant differences between paired RT distributions.
Figure 4
Figure 4
Salience comparisons of yellow versus blue and green versus red. (A, B) A salience index was calculated as the median of (1/RT) for all (A) blue-yellow and (B) red-green conditions across seven observers. (A) Yellow targets were detected significantly faster than their complementary blue targets; ○ = cardinal blue versus yellow; □ = unique yellow versus complementary blue; △ = unique blue versus complementary yellow. (B) Significant differences within red–green pairs were not reliably found; ○ = cardinal red versus green; □ = unique green versus complementary red; △ = unique red versus complementary green. Each color represents a single observer. Error bars denote 95% confidence intervals for the median. (C, D) Performance accuracy was calculated for all blue–yellow (C) and red–green (D) pairs. (C) Yellow targets were more accurately detected than their complementary blue targets. Symbols are the same as in (A). (D) Significant differences within red–green pairs were not reliably found. Symbols are the same as in (B). Each color represents a single observer. Error bars denote Clopper-Pearson 95% confidence intervals.
Figure 5
Figure 5
Color versus luminance RT differences. Median RT for the cardinal blue–yellow condition (blue, yellow points) and 10% contrast dark–light condition (black, white) are plotted for seven subjects. Error bars denote 95% confidence intervals for the median.
Figure 6
Figure 6
Role of eye movements in salience. Eye tracking revealed that significant differences in mean saccades corresponded to significant differences in RTs. O1 = observer 1; O2 = observer 2. **p < 0.01; ***p < 0.0001. Error bars denote SEM.
Figure 7
Figure 7
LFPs from recording site 130,605_2. Typical LFP responses to maximum-contrast cardinal yellow/blue (A) and green/red (B) stimuli. Magnitude of response is indicated by dashed lines; stimulus response latencies are indicated by arrows on the x axis.
Figure 8
Figure 8
LFP amplitudes and peak latencies. LFP amplitudes and latencies for full-contrast yellow versus blue stimuli (A, C) and green versus red stimuli (B, D) for 14 recording sites. Amplitudes were measured as the magnitude of difference between the maximum and minimum response after stimulus onset; latency was measured as the time of maximum response.

References

    1. Abney W. (1895). Colour vision: Being the Tyndall Lectures delivered in 1894 at the Royal Institution. New York: William Wood & Company.
    1. Bachy R., Dias J., Alleysson D., Bonnardel V. (2012). Hue discrimination, unique hues and naming. Journal of the Optical Society of America A, 29 (2), A60–A68. - PubMed
    1. Berens P., Keliris G. A., Ecker A. S., Logothetis N. K., Tolias A. S. (2008). Feature selectivity of the gamma-band of the local field potential in primate primary visual cortex. Frontiers in Neuroscience, 2 (2), 199–207. - PMC - PubMed
    1. Berlin B., Kay P. (1969). Basic colour terms: Their universality and evolution. Berkeley, CA: University of California Press.
    1. Bosten J. M., Boehm A. E. (2014). Empirical evidence for unique hues? Journal of the Optical Society of America A, 31 (4), A385–393. - PubMed

Publication types

LinkOut - more resources