Meta-Analysis
. 2015 Mar 12:5:9051.
doi: 10.1038/srep09051.

Coffee consumption and bladder cancer: a meta-analysis of observational studies

Affiliations
Meta-Analysis

Coffee consumption and bladder cancer: a meta-analysis of observational studies

Weixiang Wu et al. Sci Rep. .

Abstract

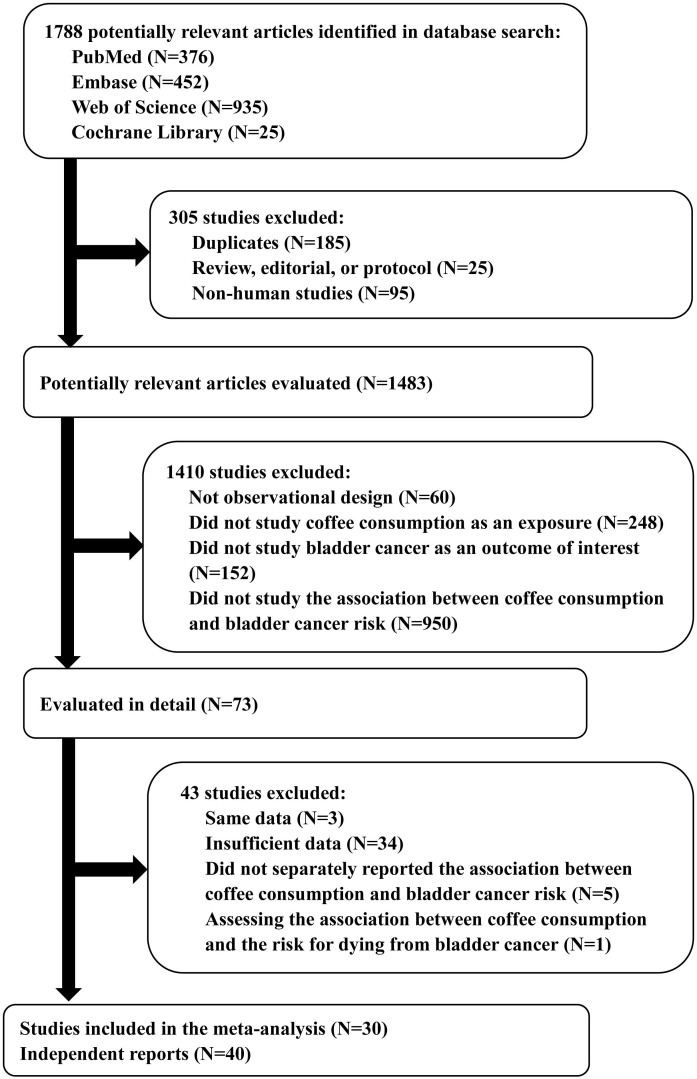
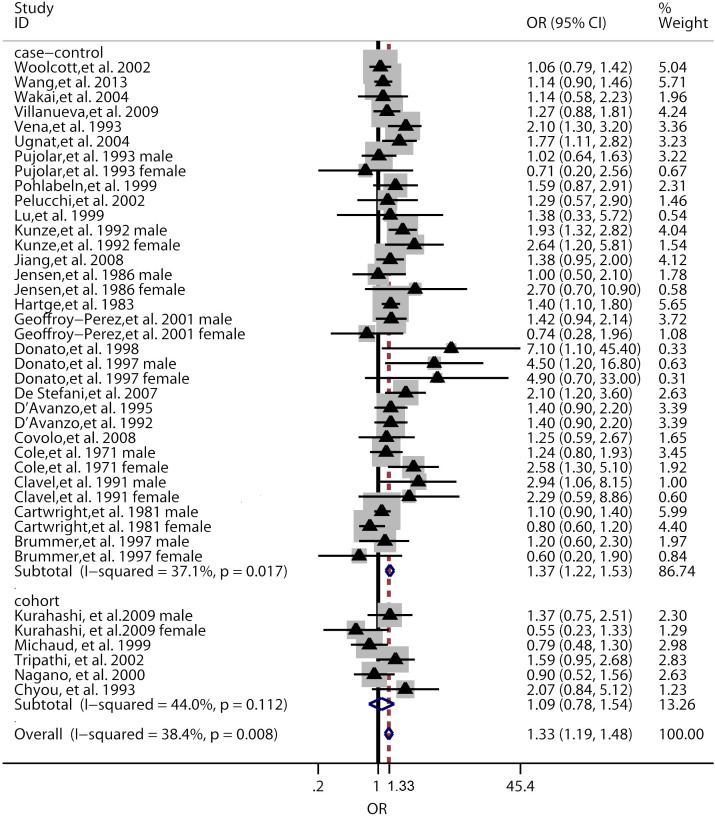
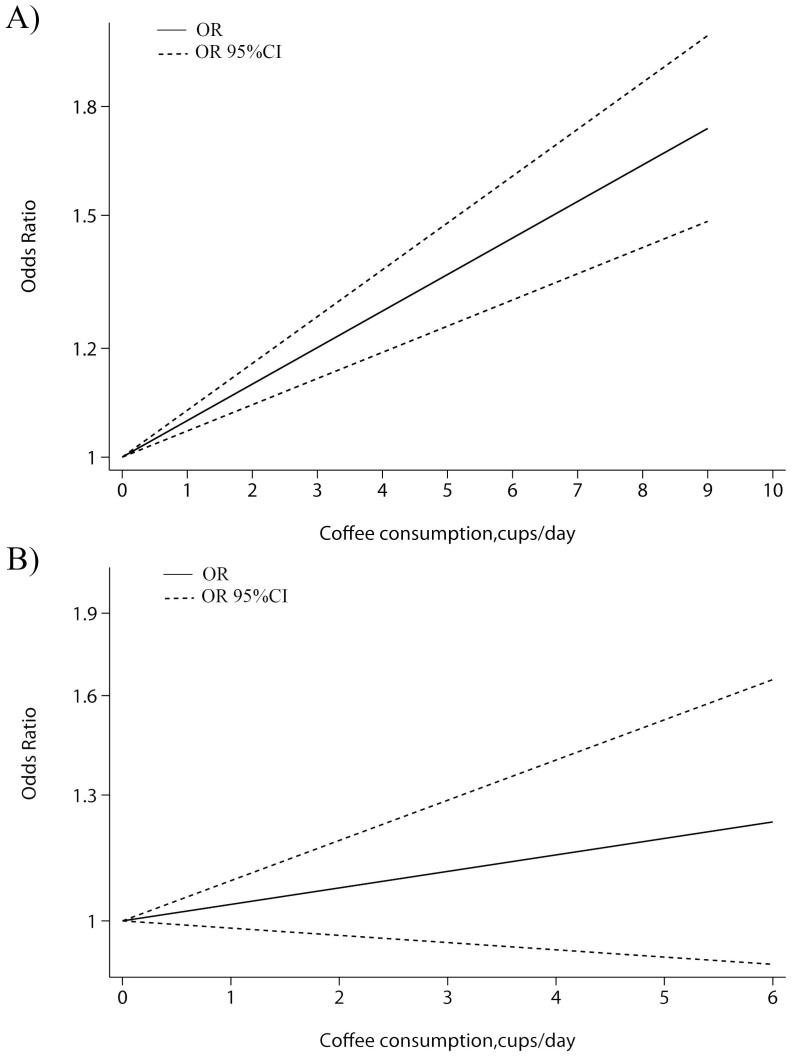
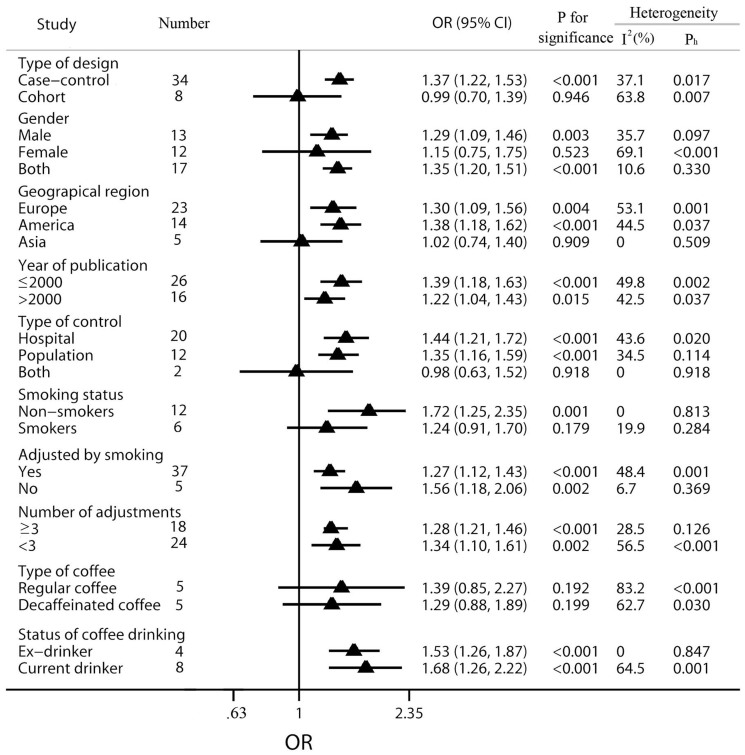
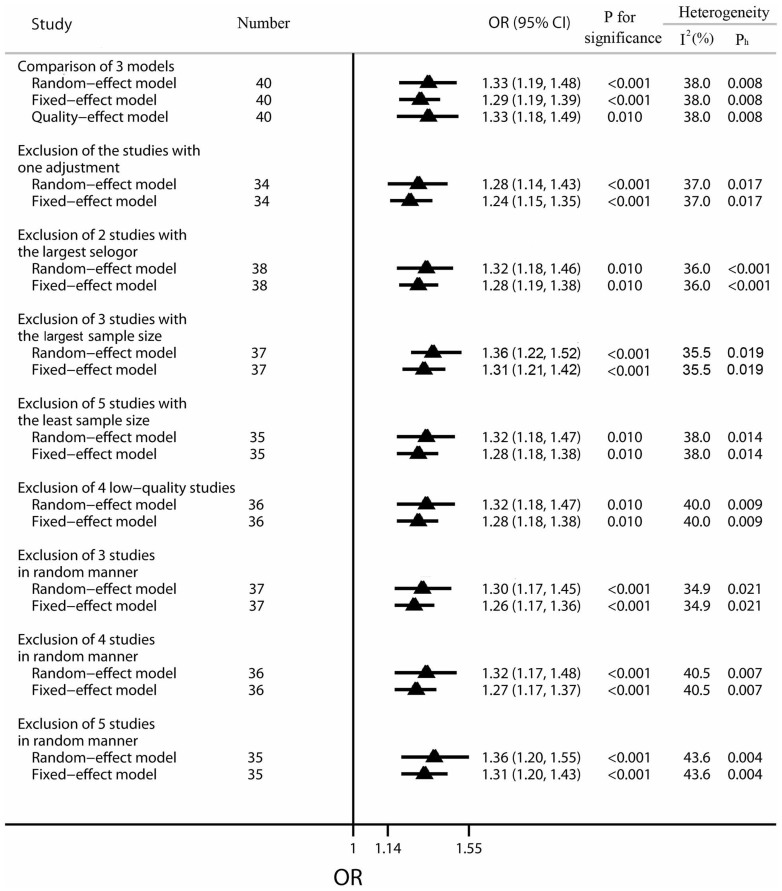
Controversial results of the association between coffee consumption and bladder cancer (BC) risk were reported among epidemiological studies. Therefore, we conducted this meta-analysis to clarify the association. Relevant studies were identified according to the inclusion criteria. Totally, 34 case-control studies and 6 cohort studies were included in our meta-analysis. The overall odds ratio (OR) with 95% confidence interval (CI) between coffee consumption and BC risk was 1.33 (95% CI 1.19 to 1.48). The summary ORs of BC for an increase of 1 cup of coffee per day were 1.05 (95% CI 1.03 to 1.06) for case-control studies and 1.03 (95% CI 0.99 to 1.06) for cohort studies. The overall ORs for male coffee drinkers, female coffee drinkers and coffee drinkers of both gender were 1.31 (95% CI: 1.08 to 1.59), 1.30 (95% CI: 0.87 to 1.96) and 1.35 (95% CI: 1.20 to 1.51). Compared with smokers (OR = 1.24, 95% CI: 0.91 to 1.70), non-smokers had a higher risk (OR = 1.72, 95% CI: 1.25 to 2.35) for BC. Results of this meta-analysis suggested that there was an increased risk between coffee consumption and BC. Male coffee drinkers and non-smoking coffee drinkers were more likely to develop BC.


Figures

Figure 1
Figure 1. Flow chart showing the relevant observational studies of coffee consumption in relation to bladder cancer.
Figure 2
Figure 2. Pooled random effects OR and 95% CIs for the association of coffee consumption and bladder cancer.
The triangles and horizontal lines correspond to the study-specific ORs and 95% CIs. The gray areas reflect the study-specific weight. The diamonds represent the pooled ORs and 95% CIs of each subgroup and overall population. The vertical solid line shows the OR of 1 and the vertical dashed line indicates the overall pooled OR of 1.33.
Figure 3
Figure 3. Dose-response relationship between coffee consumption and the risk of bladder cancer among A) case-control studies and B) cohort studies.
The solid lines represent the linear trend. The dashed lines dashes represent the pointwise 95% confidence intervals for the linear trend.
Figure 4
Figure 4. Subgroup analysis of OR of bladder cancer according to coffee consumption.
The triangles and horizontal lines correspond to the subgroup-specific ORs and 95% CIs. The vertical solid line shows the OR of 1. “Ph” represents the P value for heterogeneity from Q-test. Especially, the subgroup of type of control includes only the case-control studies, and “Both” indicates the study contains both hospital-based and population-based controls. For the subgroup stratified by the number of adjustments, “≥3” indicates the study should be adjusted at least three of the following factors: BMI, age, gender, smoking and other fluid intake.
Figure 5
Figure 5. Results of sensitivity analysis on the association between coffee consumption and the risk of bladder cancer.
The triangles and horizontal lines represent the corresponding ORs and 95% CIs. The vertical solid line shows the OR of 1. “Ph” represents the P value for heterogeneity from Q-test. Especially, “studies with one adjustment” contains Tripathi, et al. 2002, Kunze, et al. 1992 male, Kunze, et al. 1992 female, Jensen, et al. 1986 male, Jensen, et al. 1986 female and Pohlabeln, et al. 1999; “2 studies possessing the largest selogor” represents the two studies with the largest standard error of OR (Donato, et al. 1998 and Donato, et al. 1997 female); “3 studies with the largest sample size” represents Kurahashi, et al.2009 female, Kurahashi, et al.2009 male and Michaud, et al. 1999; “5 studies with the least sample size” includes Clavel, et al. 1991 female, Pujolar, et al. 1993 female, Cole, et al. 1971 female, Geoffroy-Perez, et al. 2001 female and Donato, et al. 1997 female; “ 4 low-quality studies” indicates Pelucchi, et al. 2002, Donato, et al. 1997 male, Covolo, et al. 2008 and Donato, et al. 1997 female.
Figure 6
Figure 6. Funnel plot for studies of coffee consumption in relation to bladder cancer risk.
The vertical solid line represents the summary effect estimates, and the dotted lines are pseudo 95% CIs.

Comment in

References

    1. Jemal A. et al. Global cancer statistics. CA Cancer J Clin 61, 69–90 (2011). - PubMed
    1. Leppert J. T. et al. Prevention of bladder cancer: a review. Eur Urol 49, 226–234 (2006). - PubMed
    1. Botteman M. F., Pashos C. L., Redaelli A., Laskin B. & Hauser R. The health economics of bladder cancer. Pharmacoeconomics 21, 1315–1330 (2003). - PubMed
    1. Boyle P. & Levin B. World cancer report 2008. (IARC Press, International Agency for Research on Cancer, 2008).
    1. Burger M. et al. Epidemiology and risk factors of urothelial bladder cancer. Eur Urol 63, 234–241 (2013). - PubMed

Publication types