. 2015 Apr 21;15(8):1812-21.
doi: 10.1039/c4lc01462f.

Single stream inertial focusing in a straight microchannel

Affiliations

Single stream inertial focusing in a straight microchannel

Xiao Wang et al. Lab Chip. .

Abstract

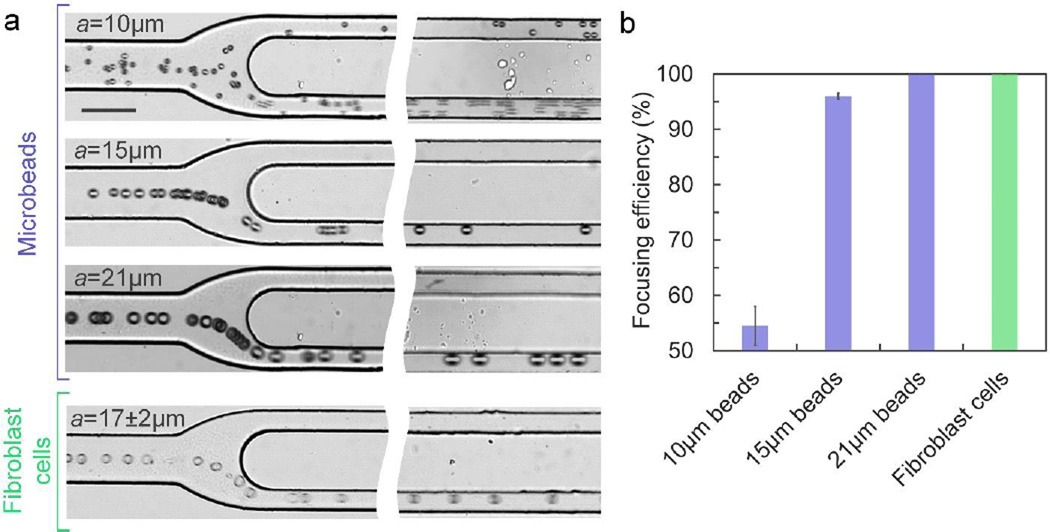
In the past two decades, microfluidics has become of great value in precisely aligning cells or microparticles within fluids. Microfluidic techniques use either external forces or sheath flow to focus particulate samples, and face the challenges of complex instrumentation design and limited throughput. The burgeoning field of inertial microfluidics brings single-position focusing functionality at throughput orders of magnitude higher than previously available. However, most inertial microfluidic focusers rely on cross-sectional flow-induced drag force to achieve single-position focusing, which inevitably complicates the device design and operation. In this work, we present an inertial microfluidic focuser that uses inertial lift force as the only driving force to focus microparticles into a single position. We demonstrate single-position focusing of different sized microbeads and cells with 95-100% efficiency, without the need for secondary flow, sheath flow or external forces. We further integrate this device with a laser counting system to form a sheathless flow cytometer, and demonstrated counting of microbeads with 2200 beads s(-1) throughput and 7% coefficient of variation. Cells can be completely recovered and remain viable after passing our integrated cytometry system. Our approach offers a number of benefits, including simplicity in fundamental principle and geometry, convenience in design, modification and integration, flexibility in focusing of different samples, high compatibility with real-world cellular samples as well as high-precision and high-throughput single-position focusing.


Figures

Figure 1
Figure 1
Sheathless 3D focusing in a straight microchannel. (a) Schematic of device principle. Lu represents the length of upstream channel. Ld represents the length of downstream channel 1. Inertial migration (b) and asymmetric flow separation (c) are combined to gradually manipulate particle cross-sectional position to achieve single-position focusing. The blue solid line in (c) indicates the separation boundary of the flow. The red dash line indicates the central streamline in upstream LAR channel. R1 and R2 represent the hydrodynamic resistance of downstream HAR channel 1 and channel 2. (d) Bright field and fluorescence images at three downstream positions showing 15µm diameter particles gradually focus into a single focal position at Re=40. Blue and red dash circles indicate microbeads focused at top and bottom channel walls. Green dash circles indicate 3D focused microbeads. (e) Single-position focusing in the present device and two-position focusing in a normal straight HAR channel as control.
Figure 2
Figure 2
Designing length of the focusing channel. (a) Theoretical calculation of the upstream low-aspect-ratio channel length Lu for focusing particles with diameter a = 7µm to a = 20µm into two focal positions near centers of top and bottom walls. (b) Theoretical calculation of the downstream length of HAR channel 1 Ld for further single position focusing. (c) Summary of channel cross-sectional dimensions of upstream and downstream segments for designs D1 to D4.
Figure 3
Figure 3
Designing the resistance ratio R2/R1. (a) CFD-ACE+ numerical simulations, downstream focusing pattern and experimental bright field images demonstrating flow separation at the bifurcation and corresponding microparticle focusing behaviour at (a) R2/R1 = 1, (b) R2/R1=3, and (c) R2/R1=∞. The red dash line represents the central streamline. The blue solid line represents flow separation boundary. The scale bar is 75µm. (d) CFD-ACE+ simulation at R2/R1=10 illustrates the effective focusing region indicated as the grey area. The yellow dash line is the mirror image of the yellow solid line against the red central streamline. (e) Quantitative study of the width of the effective focusing region at increasing R2/R1. The grey area represents width of the effective focusing region at different R2/R1. The red dotted arrow indicates the widest effective focusing region locating at R2/R1=3. The blue solid dots represent positions of the boundary streamline. The blue hollow dots represent the mirror positions against central streamline at y=0. The yellow solid dots represent the positions of secondary central streamline. The yellow hollow dots represent the mirror positions against y=0.
Figure 4
Figure 4
Optimizing Re for 3D focusing with high efficiency. (a) Experimental observation at Lu=25mm and Ld=10mm at Re=2.6, 26 and 78. The blue arrows indicate additional equilibrium positions at Re=78. The green dotted line indicates expected focusing position. The scale bar is 75µm. (b) Linescans of fluorescent intensity at Lu=25mm at Re=2.6 ~ 78. The blue arrows indicates the additional fluorescent intensity peaks at Re=78. (c) Quantitative measurement of focusing efficiency at increasing Re (n=3).
Figure 5
Figure 5
3D focusing of different sized polymer beads and cells. (a) Experimental observation of focusing of different-sized polymer microbeads and fibroblast cells at Lu=25mm and Ld=10mm at Re=40. The scale bar is 75µm. (b) Quantitative measurement of focusing efficiency of different-sized polymer microbeads and fibroblast cells at Re=40 (n=3).
Figure 6
Figure 6
Sheathless flow cytometry with high throughput and high efficiency. (a) Schematic of the custom counting system. (b) Signals of counting microbeads with diameter of 15µm during a 1s time window. (c) The voltage distribution of the signals acquired using the single-position focuser. The inset schematic illustrates cross-section of the downstream channel 1. The green dot represents particle. The blue triangle represents the laser. (d) The voltage distribution of the signals acquired in a normal LAR channel. The inset schematic illustrates cross-section of the LAR channel. The green dot represents particle. The blue triangle represents the laser. (e) Counting of microbeads with high throughput. (f) The voltage distribution of the counting signals. (g) Observation of extreme throughput in 2×10⁻⁴s time window. (h) Illustration of fluorescently labeled fibroblast cell counting during 1s time window. (i) Fluorescent and bright field images of cells after running the cytometry experiments. (j) Bright field image of cells after culturing for 2 days. The scale bars in (i) and (j) are 100µm.

References

    1. Xuan X, Zhu J, Church C. Microfluid. Nanofluid. 2010;9:1–16.
    1. Nolan JP, Sklar LA. Nat. Biotechnol. 1998;16:633–638. - PubMed
    1. Toner M, Irimia D. Annu. Rev. Biomed. Eng. 2005;7:77–103. - PMC - PubMed
    1. Karabacak NM, Spuhler PS, Fachin F, Lim EJ, Pai V, Ozkumur E, Martel JM, Kojic N, Smith K, Chen P, Yang J, Hwang H, Morgan B, Trautwein J, Barber TA, Stott SL, Maheswaran S, Kapur R, Haber DA, Toner M. Nat. Protoc. 2014;9:694–710. - PMC - PubMed
    1. Chen Y, Nawaz AA, Zhao Y, Huang P, McCoy JP, Levine SJ, Wang L, Huang TJ. Lab Chip. 2014;14:916–923. - PMC - PubMed

Publication types

LinkOut - more resources