. 2015 Feb 26:13:18.
doi: 10.1186/s12915-015-0127-3.

Distribution and impact of yeast thermal tolerance permissive for mammalian infection

Affiliations

Distribution and impact of yeast thermal tolerance permissive for mammalian infection

Vincent Robert et al. BMC Biol. .

Abstract

Background: From the viewpoint of fungal virulence in mammals, thermal tolerance can be defined as the ability to grow in the 35°C to 40°C range, which is essential for inhabiting these hosts.

Results: We used archival information in a fungal collection to analyze the relationship between thermal tolerance and genetic background for over 4,289 yeast strains belonging to 1,054 species. Fungal genetic relationships were inferred from hierarchical trees based on pairwise alignments using the rRNA internal transcribed spacer and large subunit rDNA (LSU) sequences. In addition, we searched for correlations between thermal tolerance and other archival information including antifungal susceptibility, carbon sources, and fermentative capacity. Thermal tolerance for growth at mammalian temperatures was not monophyletic, with thermally tolerant species being interspersed among families that include closely related species that are not thermal tolerant. Thermal tolerance and resistance to antifungal drugs were not correlated, suggesting that these two properties evolved independently. Nevertheless, the ability to grow at higher temperatures did correlate with origin from lower geographic latitudes, capacity for fermentation and assimilation of certain carbon sources.

Conclusions: Thermal tolerance was significantly more common among ascomycetous than basidiomycetous yeasts, suggesting an explanation for the preponderance of ascomycetous yeasts among human pathogenic fungi. Analysis of strain maximum tolerable temperature as a function of collection time suggested that basidiomycetous yeasts are rapidly adapting to global warming. The analysis identified genera with a high prevalence of the thermal-tolerant species that could serve as sources of emerging pathogenic fungi.


Figures

Figure 1
Figure 1
Unweighted Pair Group Method with Arithmetic Mean tree of ascomycetous yeasts not belonging to the Saccharomycetaceae family obtained from a distance matrix based on pairwise alignments of the ITS (ITS1-5.8S-ITS2) and 26S (D1-D2) loci. The scale bar represents the distance (0.2 means 20% distance) between the nodes of the tree.
Figure 2
Figure 2
Unweighted Pair Group Method with Arithmetic Mean tree of basidiomycetous yeasts obtained from a distance matrix based on pairwise alignments of the ITS (ITS1-5.8S-ITS2) and 26S (D1-D2) loci. The scale bar represents the distance (0.2 means 20% distance) between the nodes of the tree.
Figure 3
Figure 3
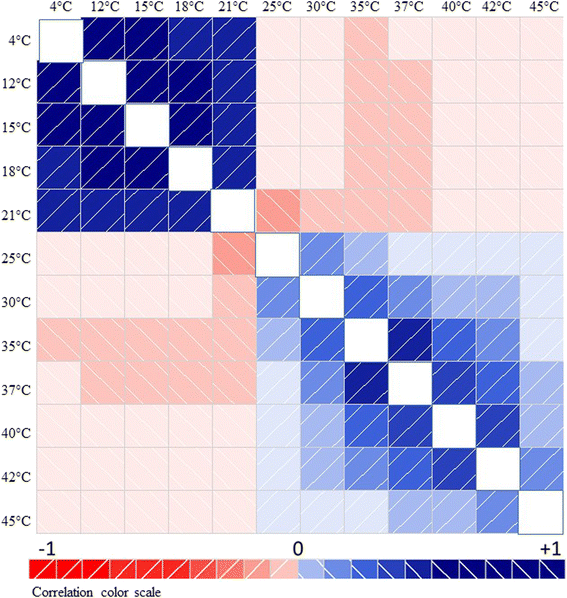
Diagram depicting the correlation of growth behavior at different temperatures by the fungal species studied. Blue and red colors denote areas of positive and negative correlation, respectively. Correlation absolute values are indicated by color intensity (bottom panel). Please see Additional file 4: Figures S4 for additional details on the correlation between color and statistical significance.
Figure 4
Figure 4
Diagram depicting the correlation between the growth intensity of the fungal species studied on fermentable C sources and on glucose at different temperatures. Blue and red colors show positive and negative correlation, respectively. Correlation absolute values are indicated by color intensity.
Figure 5
Figure 5
Trends in strain Tmax over time. (A) Trend of fungal maximum temperature of growth Tmax during the last century, compared with the global temperature index. The fungal Tmax reported was calculated from a 10-year mobile mean. The temperature index is the global mean land-ocean temperature index, 1880 to present, with the base period 1951 to 1980. (B) Regression analysis of fungal Tmax and the global temperature index during the last 30 years.

References

    1. Maheshwari R, Bharadwaj G, Bhat MK. Thermophilic fungi: their physiology and enzymes. Microbiol Mol Biol Rev. 2000;64:461–88. doi: 10.1128/MMBR.64.3.461-488.2000. - DOI - PMC - PubMed
    1. Tansey MR, Brock TD. The upper temperature limit for eukaryotic organisms. Proc Natl Acad Sci U S A. 1972;69:2426–8. doi: 10.1073/pnas.69.9.2426. - DOI - PMC - PubMed
    1. Blehert DS, Hicks AC, Behr M, Meteyer CU, Berlowski-Zier BM, Buckles EL, et al. Bat white-nose syndrome: an emerging fungal pathogen? Science. 2009;323:227. doi: 10.1126/science.1163874. - DOI - PubMed
    1. Meteyer CU, Valent M, Kashmer J, Buckles EL, Lorch JM, Blehert DS, et al. Recovery of little brown bats (Myotis lucifugus) from natural infection with Geomyces destructans, white-nose syndrome. J Wildl Dis. 2011;47:618–26. doi: 10.7589/0090-3558-47.3.618. - DOI - PubMed
    1. Rowley JJ, Alford RA. Hot bodies protect amphibians against chytrid infection in nature. Sci Rep. 2013;3:1515. doi: 10.1038/srep01515. - DOI - PMC - PubMed

Publication types

LinkOut - more resources