. 2015 Apr;25(4):558-69.
doi: 10.1101/gr.176099.114. Epub 2015 Mar 11.

Effect of minichromosome maintenance protein 2 deficiency on the locations of DNA replication origins

Affiliations

Effect of minichromosome maintenance protein 2 deficiency on the locations of DNA replication origins

Dimiter Kunnev et al. Genome Res. 2015 Apr.

Abstract

Minichromosome maintenance (MCM) proteins are loaded onto chromatin during G1-phase and define potential locations of DNA replication initiation. MCM protein deficiency results in genome instability and high rates of cancer in mouse models. Here we develop a method of nascent strand capture and release and show that MCM2 deficiency reduces DNA replication initiation in gene-rich regions of the genome. DNA structural properties are shown to correlate with sequence motifs associated with replication origins and with locations that are preferentially affected by MCM2 deficiency. Reduced nascent strand density correlates with sites of recurrent focal CNVs in tumors arising in MCM2-deficient mice, consistent with a direct relationship between sites of reduced DNA replication initiation and genetic damage. Between 10% and 90% of human tumors, depending on type, carry heterozygous loss or mutation of one or more MCM2-7 genes, which is expected to compromise DNA replication origin licensing and result in elevated rates of genome damage at a subset of gene-rich locations.


Figures

Figure 1.
Figure 1.
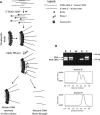
Isolation of nascent strands by nascent strand capture and release (NSCR). (A) Schematic of the approach in which a mixture of RNA-DNA chimeric nascent strands and similar sized contaminating DNA strands are first 5′ end labeled by addition of a 5′ thiophosphate and chemical modification with biotinylated maleimide. 5′-biotinylated oligonucleotides are then bound to a streptavidin column, and the nascent strand component of the bound molecules are specifically released using RNase I. (B) The efficacy of the method is demonstrated by using known substrates in which a mixture of a DNA fragment (representing contaminating DNA) and an RNA-DNA chimera (representing nascent strands and generated as an amplicon from genomic DNA using synthetic RNA[12 nt]-DNA[20 nt] primers) were mixed, 5′ biotinylated, and separated using the methodology. Lanes: B shows the input ratio; F shows the flow through following binding to the column; W shows mock treated fraction after the final wash; R shows material released by RNase I; and C shows material remaining on the column following RNase I treatment as recovered by alkali treatment. Densotometric tracings for lanes B and R are shown below the gel image.
Figure 2.
Figure 2.
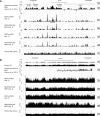
Comparison of nascent strand densities on Chr 11 from lambda exonuclease and NSCR purifications. A comparison of the nascent strand densities obtained by lambda exonuclease-based purification from wt MEFs in a previous study (Cayrou et al. 2011) and by NSCR from wt or MCM2-deficient MEFs in the present study. (A) An ∼45-kbp region of Chr 11 centered on the Hoxb4 gene; (B) all of Chr 11. For each panel: (1) scale and gene tracks; (2) lambda exonuclease SNS data; (3,5) NSCR-SNS data from wt cells, experiments 1 and 2; (4,6) NSCR-SNS data from MCM2-deficient cells, experiments 1 and 2; (7) total genomic DNA from thymus. In B, percentage GC is included in (1).
Figure 3.
Figure 3.
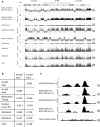
Effect of MCM2 deficiency on nascent strand density. (A) All of Chr 11 (assembly mm9) with scale and chromosome band above the tracks. (1) Wt-deficient difference for exp. 1; (2) wt-deficient difference for exp. 2; (3) UCSC gene density; (4) replication timing (FSU repli-ChIP for MEF; The ENCODE Project Consortium 2012, FSU ENCODE group); (5) lamin B1 (NKI nuclear lamina, lamin B1 for MEF; Peric-Hupkes et al. 2010); (6) CpG island density; (7) H3K4me1 (LICR histone H3K4me1 for MEF; The ENCODE Project Consortium 2012, Ren Laboratory); (8) H3K4me3 (LICR histone H3K4me3 for MEF; The ENCODE Project Consortium 2012, Ren Laboratory); (9) CTCF (LICR TFBS CTCF for MEF; The ENCODE Project Consortium 2012, Ren Laboratory). (B) Correlation coefficients between different tracks calculated using the UCSC Table Browser for Chr 11 as indicated in the figure. C shows a ∼2-kbp region from Chr 10 where (1) is wt exp. 1; (2) is MCM2-deficient exp. 1; (3) is wt exp. 2; (4) is MCM2-deficient exp. 2; and (5) is total thymic DNA for the same region (control).
Figure 4.
Figure 4.
Sequence motifs enriched near to NSCR-SNS peaks. (AD) Plots of the number of instances (y-axis) that the midpoint of G-quadruplexes (A,B) or TGn ≥ 4 dinucleotide repeats (C,D), oriented relative to the G or TG-containing strands, respectively, occur relative to the location of SNS peak maxima (position 2001) for 4-kbp regions of DNA surrounding each peak. Data from wt cells are shown in red and MCM2-deficient cells in blue, in which A and C show results from exp. 1, and B and D show results from exp. 2. (E,F) Similar plots of motifs enriched in wt unique (E; CYCAGCC) or MCM2-deficient unique (F; ATAWTW) peaks from exp. 1 (wt: red; MCM2-deficient: blue). Plots for additional motifs and for exp. 2 peaks are shown in Supplemental Figures S3 and S4. (G,H) Structural properties of DNA plotted relative to NSCR-SNS peak positions, in which G is average DNA stiffness and H is average consensus DNA bendability for wt (red) and MCM2-deficient (blue) “unique” peaks for peaks that are common between exp. 1 and exp. 2.
Figure 5.
Figure 5.
Relationship between the effect of MCM2 deficiency on nascent strand density in MEFs and locations of CNVs in tumors. (A) Region of Chr 2 where recurrent deletions were found in the Notch1 gene (Rusiniak et al. 2012) of thymic lymphocytic leukemias (T-LLs) arising in MCM2-deficient mice as indicated and compared to NSCR wt minus deficient difference values over the same region. (B) Similar comparison for the Mbd3/Tcf3 locus on Chr 10. (C) Plot, in rank order, of the average NSCR wt minus MCM2-deficient values from exp. 1 over the length of each deletion for each of 142 deletions identified in T-LLs arising in MCM2-deficient mice (Rusiniak et al. 2012). (D) The data in D are based on the same deletions as in C, where NSCR wt minus MCM2-deficient values for deletions recurring at the same sites in different tumors were averaged, and the average NSCR wt minus MCM2-deficient value is plotted against the frequency with which deletions recurred (circles). The triangles indicate the average NSCR wt minus MCM2-deficient value for all deletions at different levels of recurrence except that three outliers (Pten, Rfx7, and unknown) were excluded. Similar results were found for data from exp. 2; and for both exp. 1 and exp. 2, bootstrap analysis (Supplemental Fig. S9), and demonstrates a significant (P < 0.001) association between sites of recurrent deletions as well as a preferential effect of MCM2 deficiency on nascent strand density over the deletion intervals.
Figure 6.
Figure 6.
Putative loss-of-function alterations in RLF genes across tumor types. The proportion of tumors that carry heterozygous loss or mutation of MCM2-7 individually or as a group and all RLFs (MCM2-7, CDC6, CDT1, and ORC1-6) as indicated in the key across different cancer types: AML, Acute Myeloid Leukemia; BUC, Bladder Urothelial Carcinoma; BIC, Breast Invasive Carcinoma; CSCC, Cervical Squamous Cell Carcinoma and Endocervical Carcinoma; CRA, Colon and Rectum Adenocarcinoma; GBM, Glioblastoma Multiforme; HNSC, Head and Neck Squamous Cell Carcinoma; KRCC, Kidney Renal Clear Cell Carcinoma; LACT, Lung Adenocarcinoma (TCGA Provisional); LACB (Broad); LSCC, Lung Squamous Cell Carcinoma; OSC, Ovarian Serous Cystadenocarcinoma; PAC, Prostate Adenocarcinoma; SCM, Skin Cutaneous Melanoma; SAC, Stomach Adenocarcinoma; TC, Thyroid Carcinoma; UCEC, Uterine Corpus Endometrioid Carcinoma.

References

    1. Aird D, Ross MG, Chen WS, Danielsson M, Fennell T, Russ C, Jaffe DB, Nusbaum C, Gnirke A. 2011. Analyzing and minimizing PCR amplification bias in Illumina sequencing libraries. Genome Biol 12: R18. - PMC - PubMed
    1. Bailey TL. 2011. DREME: motif discovery in transcription factor ChIP-seq data. Bioinformatics 27: 1653–1659. - PMC - PubMed
    1. Bain G, Engel I, Robanus Maandag EC, te Riele HP, Voland JR, Sharp L, Chun J, Huey B, Pinkel D, Murre C. 1997. E2A deficiency leads to abnormalities in αβ T-cell development and to rapid development of T-cell lymphomas. Mol Cell Biol 17: 4782–4791. - PMC - PubMed
    1. Besnard E, Babled A, Lapasset L, Milhavet O, Parrinello H, Dantec C, Marin JM, Lemaitre JM. 2012. Unraveling cell type–specific and reprogrammable human replication origin signatures associated with G-quadruplex consensus motifs. Nat Struct Mol Biol 19: 837–844. - PubMed
    1. Bielinsky AK, Gerbi SA. 1998. Discrete start sites for DNA synthesis in the yeast ARS1 origin. Science 279: 95–98. - PubMed

Publication types

Substances