

Anti-BDCA2 monoclonal antibody inhibits plasmacytoid dendritic cell activation through Fc-dependent and Fc-independent mechanisms
- PMID: 25762615
- PMCID: PMC4403047
- DOI: 10.15252/emmm.201404719
Anti-BDCA2 monoclonal antibody inhibits plasmacytoid dendritic cell activation through Fc-dependent and Fc-independent mechanisms
Abstract
Type I interferons (IFN-I) are implicated in the pathogenesis of systemic lupus erythematosus (SLE). In SLE, immune complexes bind to the CD32a (FcγRIIa) receptor on the surface of plasmacytoid dendritic cells (pDCs) and stimulate the secretion of IFN-I from pDCs. BDCA2 is a pDC-specific receptor that, when engaged, inhibits the production of IFN-I in human pDCs. BDCA2 engagement, therefore, represents an attractive therapeutic target for inhibiting pDC-derived IFN-I and may be an effective therapy for the treatment of SLE. In this study, we show that 24F4A, a humanized monoclonal antibody (mAb) against BDCA2, engages BDCA2 and leads to its internalization and the consequent inhibition of TLR-induced IFN-I by pDCs in vitro using blood from both healthy and SLE donors. These effects were confirmed in vivo using a single injection of 24F4A in cynomolgus monkeys. 24F4A also inhibited pDC activation by SLE-associated immune complexes (IC). In addition to the inhibitory effect of 24F4A through engagement of BDCA2, the Fc region of 24F4A was critical for potent inhibition of IC-induced IFN-I production through internalization of CD32a. This study highlights the novel therapeutic potential of an effector-competent anti-BDCA2 mAb that demonstrates a dual mechanism to dampen pDC responses for enhanced clinical efficacy in SLE.
Keywords: BDCA2; Fc receptors; immune complexes; plasmacytoid dendritic cells; systemic lupus erythematosus.
© 2015 Biogen Idec. Published under the terms of the CC BY 4.0 license.
Figures
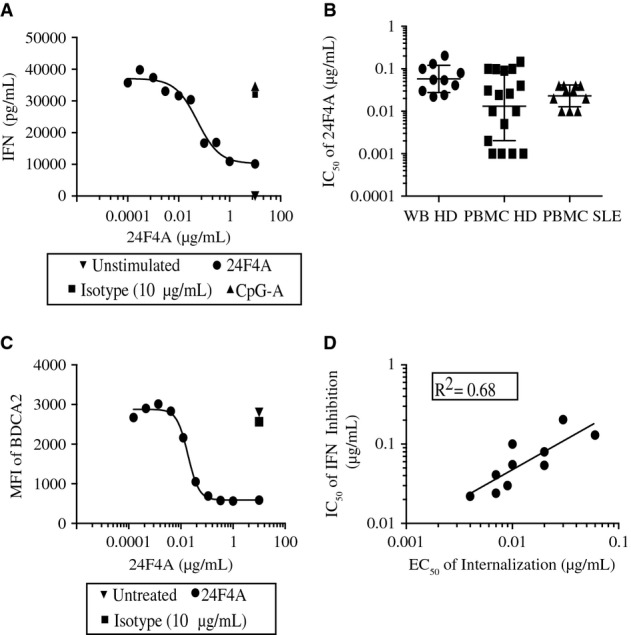
A, B Whole blood or PBMC were treated with increasing concentrations of 24F4A and stimulated with CpG-A for 16 h at 37°C. Anti-BDCA2-mediated IFNα inhibition in whole-blood assays (A). IFNα levels were detected using human IFNα ELISA. Graph depicts average of duplicate wells of one representative donor (n = 10). IC50 of 24F4A-mediated IFNα inhibition (B) in whole blood (circles) (n = 10) and PBMC (n = 18) from healthy human donors (squares) or SLE patients (triangles) (n = 11). Horizontal bar represents the mean IC50 for each sample type. Error bars represent SD of IC50 between donors.
C Anti-BDCA2-mediated internalization in whole-blood assays. Whole blood was treated with increasing concentrations of 24F4A for 16 h. Mean fluorescence intensity (MFI) of BDCA2 was determined with a non-cross-blocking anti-BDCA2 mAb (2D6). Shown is a representative plot of 10 experiments conducted.
D The IC50 of 24F4A-mediated IFNα inhibition was compared to the EC50 of 24F4A-induced BDCA2 internalization.
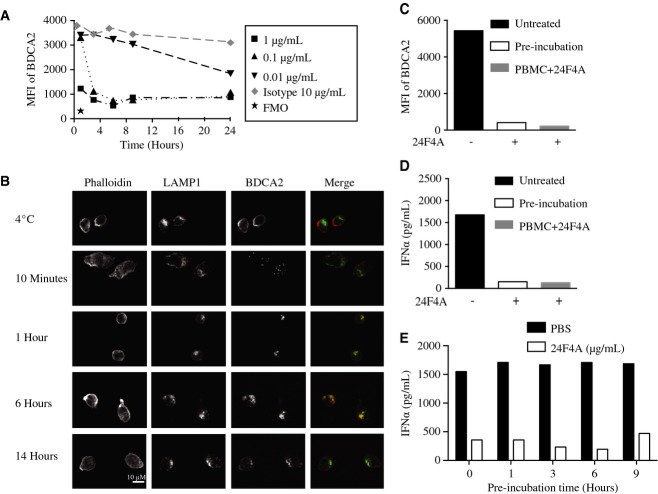
A Whole blood was treated with the indicated concentrations of 24F4A or the IgG1 isotype control antibody for 0, 1, 3, 6, 9, and 24 h. FACS analysis was performed to determine BDCA2 levels on pDCs. Fluorescence minus one (FMO) represents background staining of BDCA2. Shown is a representative plot of three independent experiments.
B Isolated pDCs were treated with 10 μg/ml 24F4A-AF647 at 4°C or at 37°C and analyzed at the indicated time points. Subcellular localization of BDCA2 (red) compared to LAMP1 (green) was assessed using confocal microscopy. Phalloidin was used to delineate the cell membrane. Yellow represents co-localization of BDCA2 and LAMP1. Shown is a representative image of four experiments conducted.
C, D Whole blood was either treated with 24F4A for 1 h at 37°C (pre-incubation) or left untreated. PBMC were isolated from each condition. PBMC from the untreated whole blood were subsequently treated with 10 μg/ml 24F4A, and cells from all conditions were stimulated with CpG-A for 16 h. Plot represents mean of duplicate wells. Flow cytometry was used to measure BDCA2 levels (MFI). Shown is a representative donor of eight donors tested.
E Whole blood was pre-treated for 0, 1, 3, 6, and 9 h with 10 μg/ml of 24F4 or the isotype control and then stimulated with CpG-A for additional 16 h. IFNα levels were measured by ELISA. Shown is a representative plot of two independent experiments.
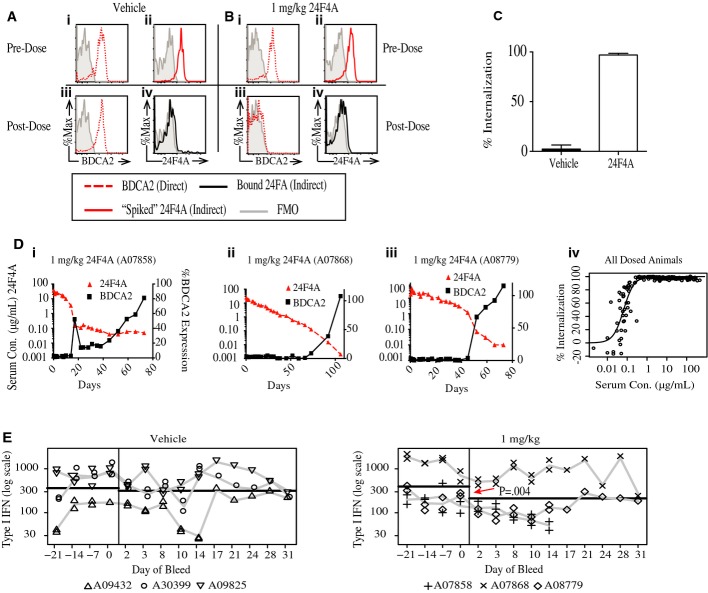
A–C Prior to in vivo dosing, baseline surface levels of BDCA2 for both the vehicle (Ai) and 1 mg/kg (Bi) animals (red, dotted line) were established by staining with fluorescently labeled 24F4A (direct method). Maximal binding of 24F4A to BDCA2 was also established pre-dose in the vehicle (Aii) and 1 mg/kg (Bii) animals (red, solid line) by treating whole blood with 10 μg/ml of 24F4A at 4°C and then detecting bound 24F4A with a fluorescently labeled anti-human IgG1 (indirect method). The direct method was used to stain whole blood from both the vehicle (Aiii) and 1 mg/kg 24F4A (Biii) animals 6 h post-dose (red, dotted line). In a separate stain, the indirect method was used to detect bound 24F4A in the vehicle (Aiv) and 1 mg/kg (Biv) treated animals (black, solid line). (C) Percent BDCA2 internalization relative to pre-dose BDCA2 levels 6 h post-dose with vehicle, 10 mg/kg, or 1 mg/kg 24F4A. Graph shows mean ± standard deviation for each group (n = 3).
D PK/PD relationship between 24F4A serum concentrations (red triangle, left axis) and BDCA2 expression on pDCs (black squares, right axis, normalized to pre-dose levels) from the 1 mg/kg group (i–iii). Serum 24F4A was measured by ELISA. (iv) Percent BDCA2 internalization versus serum concentration of 24F4A for all dosed cynomolgus monkeys at all time points tested.
E Whole blood from vehicle- or 1 mg/kg 24F4A-treated monkeys was stimulated with CpG-A, and induction of IFN-I was measured by MxA bioassay at various time points pre- and post-treatment. Horizontal black lines represent the model-based estimates of the geometric mean of IFN-I in pre- and post-dose samples. Duplicate symbols represent independent replicates of the MxA bioassay for that time point. Statistical analysis was performed using a two-way mixed-effects analysis of variance (ANOVA).
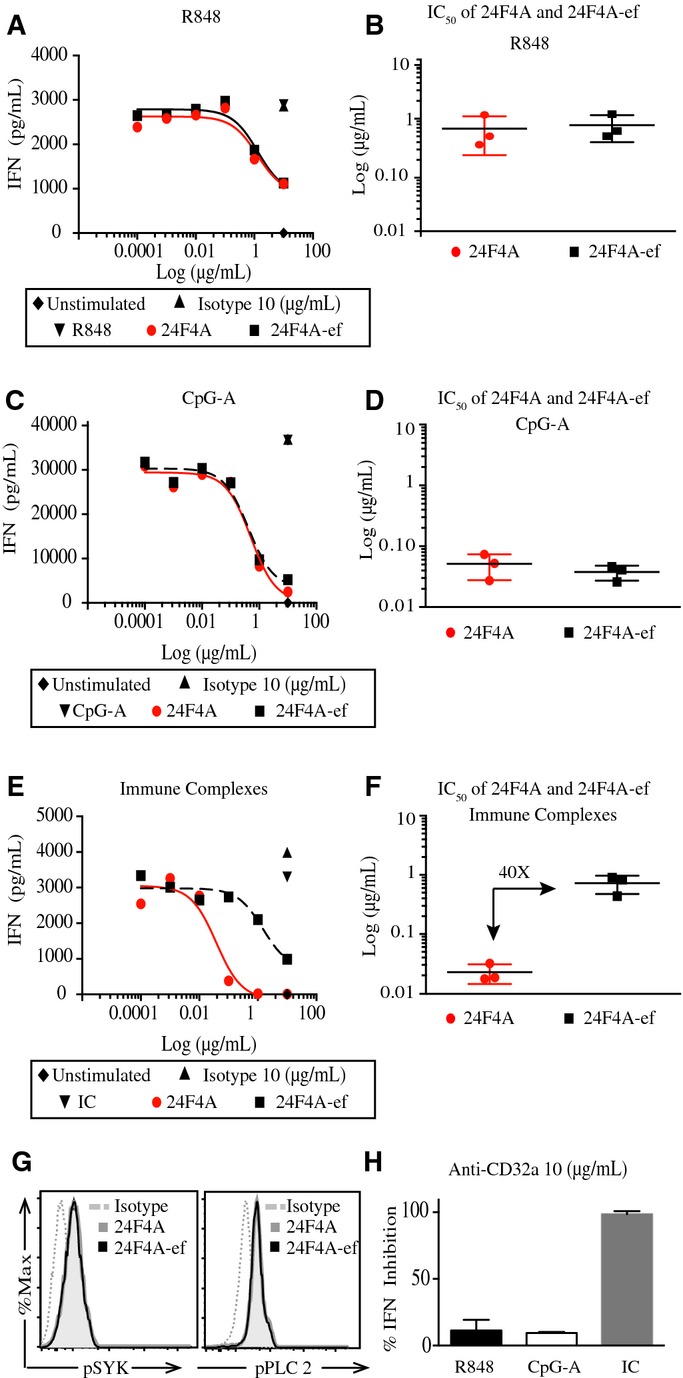
A–F Isolated human pDCs were treated with increasing concentrations of 24F4A (red circles), 24F4A-ef (black squares), or 10 μg/ml of the isotype control (black triangle) and stimulated with 5 μM of R848 (A and B), 1 μM of CpG-A (C and D), or immune complexes (E and F) for 16 h at 37°C. IFNα concentrations in cultured supernatants were determined using ELISA. Representative plots for each stimulation (A, C and E) and the average IC50 of 24F4A and 24F4A-ef for each stimulation condition (B, D and F) are shown (n = 3). Horizontal bars represent mean IC50, and error bars represent SD of the mean from three independent experiments.
G Isolated human pDCs were treated with 10 μg/ml of 24F4A (black line), 24F4A-ef (gray shaded histogram), or the isotype control (gray dotted line) for 10 min at 37°C. Flow cytometry was used to evaluate pSYK and pPLCγ2. Shown is a representative plot of two independent experiments.
H Isolated pDCs treated with 10 μg/ml of anti-CD32a (AT10) and stimulated with CpG-A, R848, or immune complexes. Error bars represent SD of percent inhibition of IFNα from three independent experiments.
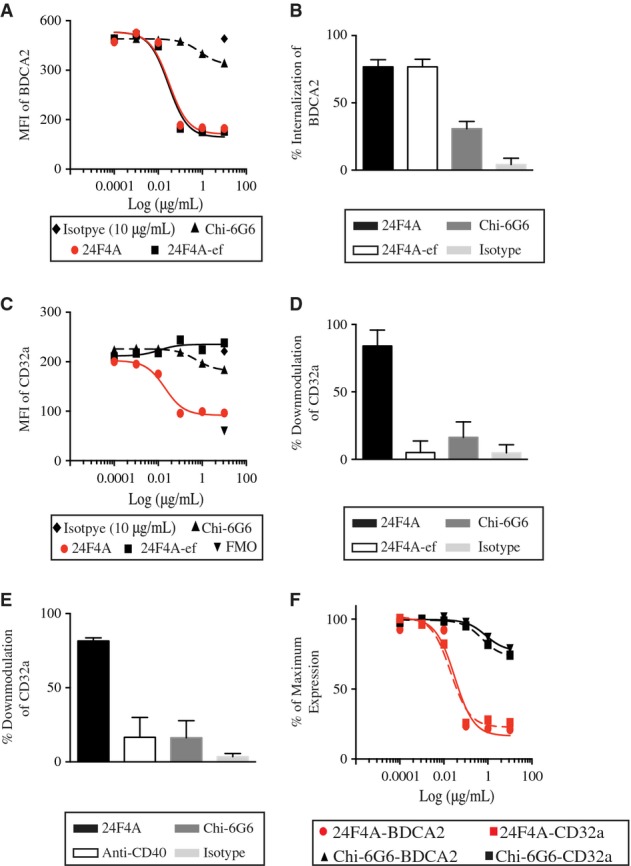
A–F Isolated pDCs were treated with increasing concentrations of 24F4A (red circles), 24F4A-ef (squares), Chi-6G6 (triangle), or isotype control (diamond) for 16 h at 37°C and stimulated with CpG-A. Flow cytometry was performed to evaluate the MFI of (A) BDCA2 and (C) CD32a on the surface of pDCs. Percent internalization of BDCA2 (B) and CD32a (D) on pDCs treated with 10 μg/ml of 24F4A, 24F4A-ef, Chi-6G6, or isotype control. Error bars represent SD of percent internalization of five experiments conducted. (E) Percent CD32a downmodulation on isolated pDCs treated with 10 μg/ml of an anti-CD40 mAb. Error bars represent SD of percent downmodulation of two independent experiments. FMO represents background staining of CD32a (inverted triangle). (F) Percent of maximal expression of BDCA2 or CD32a in the presence of increasing concentrations of 24F4A or Chi-6G6. Maximal expression was defined by the MFI of both BDCA2 and CD32a on untreated cells. Shown is a representative plot of five independent experiments conducted.
References
-
- Bave U, Magnusson M, Eloranta ML, Perers A, Alm GV, Ronnblom L. Fc gamma RIIa is expressed on natural IFN-alpha-producing cells (plasmacytoid dendritic cells) and is required for the IFN-alpha production induced by apoptotic cells combined with lupus IgG. J Immunol. 2003;171:3296–3302. - PubMed
-
- Blomberg S, Eloranta ML, Cederblad B, Nordlin K, Alm GV, Ronnblom L. Presence of cutaneous interferon-alpha producing cells in patients with systemic lupus erythematosus. Lupus. 2001;10:484–490. - PubMed
-
- Blomberg S, Eloranta ML, Magnusson M, Alm GV, Ronnblom L. Expression of the markers BDCA-2 and BDCA-4 and production of interferon-alpha by plasmacytoid dendritic cells in systemic lupus erythematosus. Arthritis Rheum. 2003;48:2524–2532. - PubMed
MeSH terms
Substances
LinkOut - more resources
Full Text Sources
Other Literature Sources
