. 2015 Apr 6;12(105):20150080.
doi: 10.1098/rsif.2015.0080.

The network motif architecture of dominance hierarchies

Affiliations

The network motif architecture of dominance hierarchies

Daizaburo Shizuka et al. J R Soc Interface. .

Abstract

The widespread existence of dominance hierarchies has been a central puzzle in social evolution, yet we lack a framework for synthesizing the vast empirical data on hierarchy structure in animal groups. We applied network motif analysis to compare the structures of dominance networks from data published over the past 80 years. Overall patterns of dominance relations, including some aspects of non-interactions, were strikingly similar across disparate group types. For example, nearly all groups exhibited high frequencies of transitive triads, whereas cycles were very rare. Moreover, pass-along triads were rare, and double-dominant triads were common in most groups. These patterns did not vary in any systematic way across taxa, study settings (captive or wild) or group size. Two factors significantly affected network motif structure: the proportion of dyads that were observed to interact and the interaction rates of the top-ranked individuals. Thus, study design (i.e. how many interactions were observed) and the behaviour of key individuals in the group could explain much of the variations we see in social hierarchies across animals. Our findings confirm the ubiquity of dominance hierarchies across all animal systems, and demonstrate that network analysis provides new avenues for comparative analyses of social hierarchies.

Keywords: aggression; orderliness; peck order; social networks; transitivity; triad census.


Figures

Figure 1.
Figure 1.
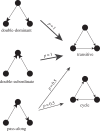
The five connected triads with asymmetric relations. The arrows show the probability, p, with which a given two-edge triad becomes a triangle given equal probability of new arrow pointing to the left or right. Double-dominant triads and double-subordinate triads can become transitive only even when the null dyadic relation becomes established. Pass-along triads can become either a transitive or cycle with equal probability.
Figure 2.
Figure 2.
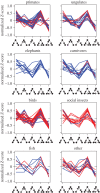
Dominance relations show consistent patterns of triadic motifs across taxonomic groups. The significance profiles for each taxonomic group show the same general pattern of variation. The ‘other’ group includes rodents, marsupials, reptiles and non-social insects. Blue lines represent studies in animal groups in natural settings, and red lines represent captive groups.
Figure 3.
Figure 3.
Correlations of significance profiles show that triadic patterns are consistent across taxonomic groups. For a given cell in row a, column b, the colour spectrum represents the correlation coefficient (ra,b) between the significance profiles. The rows and columns are organized by taxonomic group, shown on the left. The numbers above correspond to row/column numbers shown in electronic supplementary material, table S1. The 34 groups in which there were no null dyads were excluded, because the full significance profile cannot be calculated in the absence of at least one null dyad. If dominance structures within taxonomic groups resembled each other more closely than those of different groups, then there should be clusters of high correlations along the diagonal. Instead, the colours are fairly uniform across the plot, showing that taxonomic groups do not systematically vary in social structure. One group of lowland gorillas ([44]; row/column 9) showed a highly intransitive dominance structure that caused their triad structure to be negatively correlated with most of the other taxa, producing one light horizontal stripe and one light vertical stripe.
Figure 4.
Figure 4.
Correlations between network density on triad frequencies. The frequencies of pass-along and transitive triads are positively correlated with network density, whereas the frequencies of double-dominant and cycle triads are negatively correlated with network density. Note that the correlation with double-dominant triads disappear after controlling for pseudo-replication of species in the dataset.
Figure 5.
Figure 5.
Correlations between the interaction rate of the top-ranked individual (Iα) and triad frequencies. The frequencies of double-dominant triads are positively related to the propensity for top-ranked individuals to engage in more contests. Conversely, there are fewer pass-along triads in groups where top individuals engage in more contests.

References

    1. Hawley PH. 1999. The ontogenesis of social dominance: a strategy-based evolutionary perspective. Dev. Rev. 19, 97–132. (10.1006/drev.1998.0470) - DOI
    1. Savin-Williams RC. 1979. Dominance hierarchies in groups of early adolescents. Child. Dev. 4, 923–935. (10.2307/1129316) - DOI
    1. Wilson EO. 2000. Sociobiology, 25th anniversary edn Cambridge, MA: Belknap Press.
    1. Chase I. 1980. Social process and hierarchy formation in small groups: a comparative perspective. Am. Sociol. Rev. 45, 905–924. (10.2307/2094909) - DOI
    1. Ellis L. 1995. Dominance and reproductive success among nonhuman animals: a cross-species comparison. Ethol. Sociobiol. 16, 257–333. (10.1016/0162-3095(95)00050-U) - DOI

Publication types

LinkOut - more resources