. 2015 Mar 11;35(10):4306-18.
doi: 10.1523/JNEUROSCI.2451-14.2015.

Representation of accumulating evidence for a decision in two parietal areas

Affiliations

Representation of accumulating evidence for a decision in two parietal areas

Victor de Lafuente et al. J Neurosci. .

Abstract

Decisions are often made by accumulating evidence for and against the alternatives. The momentary evidence represented by sensory neurons is accumulated by downstream structures to form a decision variable, linking the evolving decision to the formation of a motor plan. When decisions are communicated by eye movements, neurons in the lateral intraparietal area (LIP) represent the accumulation of evidence bearing on the potential targets for saccades. We now show that reach-related neurons from the medial intraparietal area (MIP) exhibit a gradual modulation of their firing rates consistent with the representation of an evolving decision variable. When decisions were communicated by saccades instead of reaches, decision-related activity was attenuated in MIP, whereas LIP neurons were active while monkeys communicated decisions by saccades or reaches. Thus, for decisions communicated by a hand movement, a parallel flow of sensory information is directed to parietal areas MIP and LIP during decision formation.

Keywords: LIP; MIP; decision-making; reaches; saccades; sensory.


Figures

Figure 1.
Figure 1.
Monkeys were trained to indicate the direction of random-dot motion with either a hand or an eye movement. After eye and hand fixation, two peripheral choice targets appeared, followed by the random-dot motion display centered at the FP. The direction of motion (left or right), difficulty, and viewing duration were randomized from trial to trial. After a variable delay, either the eye or hand fixation spot was extinguished, instructing the monkey to communicate its decision by looking or reaching to the choice target. All correct trials and a random half of the 0% coherence motion trials were rewarded. The same effector was used for blocks of ∼240 trials. The monkeys had to maintain fixation with the unused effector until reward delivery. During neuronal recordings, one of the choice targets (termed Tin) was in the neuronal RF.
Figure 2.
Figure 2.
Analyses of behavioral data. a, Decision accuracy depends on the strength of motion but not on the effector modality used to report the choice. Points are the proportion correct for all viewing durations. Sigmoidal curves are best fitting Weibull functions. The discrimination threshold is the motion coherence that supports a proportion correct = 0.816 (α; Eq. 1). The data are shown separately for the two monkeys but combined henceforth. b, Time course over which fluctuations in stimulus motion information guides the decision about direction. Gray curve shows the mean motion energy (±1 SEM) in support of the monkey's choice on trials in which 0% coherence motion stimuli were shown. The blue curve shows the response to a single dot appearing at t = 0 and displaced in the positive direction 40 ms later (same Δxt as in the variable coherence display). Choices were affected most strongly by the first ∼250 ms of motion fluctuations in the noisy display, and information continued to affect choices for longer durations on some trials. c, Accuracy increases as a function of motion strength and stimulus duration. Thin lines are running means of the proportion correct. Smooth curves are fits to a model that assume noisy evidence is integrated to a termination threshold or bound. The behavior is best explained by perfect integration of information presented early in the trial, consistent with the analysis in c. The rate of improvement and saturation are explained by variance in the termination times across trials and motion strengths, as occurs in reaction time experiments. d, Decision times estimated from the bounded evidence accumulation model fit. Points are mean decision times predicted from the model. Error bars indicate ±1 SD.
Figure 3.
Figure 3.
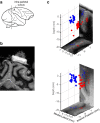
Location of recording sites. a, The vertical line in the diagram (top) marks the approximate location of the coronal magnetic resonance image (bottom), 6 mm posterior to the interaural line. b, The recording chamber containing a saline-filled grid is visible above the IPS. The MRI was obtained on a 1.5 T scanner using a short T1 inversion-recovery sequence. Cranial screws (titanium) caused the susceptibility artifact, which appear as black indentations of the cortex on either side of the recording chamber. c, The recording location of MIP (blue) and LIP (red) neurons is plotted in stereotactic coordinates and projected to MRI slices oriented parallel to the recording chamber (top and bottom corresponds to monkeys G and T, respectively). Locations were assessed by registration and are therefore only approximate.
Figure 4.
Figure 4.
Activity of neurons during a delayed center-out task. Monkeys were required to shift the gaze or hand to the remembered location of a briefly flashed target. Average firing rates are shown for target locations used in the main discrimination task, inside (Tin) or outside (Tout) the RF of the neuron. a, b, Response averages from 48 MIP neurons recorded in reach and saccade blocks, respectively. c, d, Response averages from 51 LIP neurons recorded in reach and saccade blocks, respectively.
Figure 5.
Figure 5.
Responses from two representative neurons recorded during the motion discrimination task. Each row of black dots mark the times of action potentials with respect to onset of targets (left), onset of random-dot motion (middle), and movement initiation (right). Colored dots signify the end of the motion stimulus. Trials are sorted according to stimulus strength (colored numbers), stimulus duration, and monkey's behavioral response (Tin and Tout choices). Only correct choices are shown for nonzero coherences. a, b, Responses from an MIP neuron recorded in reach and saccade blocks, respectively. c, d, Responses from an LIP neuron recorded in reach and saccade blocks, respectively.
Figure 6.
Figure 6.
Neural response selectivity in MIP and LIP as a function of effector modality and movement direction. a, Comparison of response magnitude in the delay period before saccades and reaches to Tin. Points represent mean firing rate in the 500 ms epoch ending 200 ms before movement onset. Symbol type and color indicate monkey and parietal area, respectively (n = 133). Note that the majority of LIP and MIP neurons exhibited higher firing rates during the reach trials. b, Time course of choice selectivity in MIP (blue) and LIP (red) on easy trials. The index quantifies the separation of the distributions of responses associated with Tin and Tout choices (area under the ROC). Line type indicates effector modality. Choice selectivity begins earlier in MIP but is present in both parietal areas for both effector modalities. Only correct choices on the two highest motion coherences are included in this analysis.
Figure 7.
Figure 7.
Evolution of neural responses during decision formation. Responses are aligned in time to the onset of random-dot motion. The strength and direction of motion are indicated by color and line type. Trials ending in either choice are included in the averages. The firing rates from each MIP neuron (a, b) were normalized to the average delay activity before reaches to Tin. The firing rates from each LIP neuron (c, d) were normalized to the average delay activity before saccades to Tin. Response averages were smoothed using a causal exponential kernel (τ = 30 ms). Inset graphs show the effect of motion strength on the rate of change (buildup rate) of the normalized average firing rates during the first 150 ms of putative integration, indicated by the gray bars. This is ∼70 ms earlier in MIP than in LIP (see Materials and Methods). Lines are weighted least square fits to these buildup rates.
Figure 8.
Figure 8.
Evolution of neural responses during decision formation, conditioned on choice. Conventions are the same as in Figure 7, except traces contain only those trials that end in the same choice. Only correct choices are included for nonzero motion strengths.
Figure 9.
Figure 9.
Evolution of response variance and autocorrelation of firing rates during decision formation. These analyses examine the correspondence between data and predictions from a diffusion process. a, Expected autocorrelation matrix for a discrete diffusion process (upper triangular portion of the symmetric correlation matrix). The autocorrelation is between the value of a random variable formed as the cumulative sum of independent identically distributed numbers (increments) in the ith and jth time step of its evolution (i = 1–5; j = 2–6). Six time steps are shown to correspond with the same number of time bins applied to data. Heat map displays the values of the 15 predicted r values (i.e., the unique r values of the 6 × 6 correlation matrix). Notice that correlation between bins decreases as a function of the time lag between them (dashed line), and correlations separated by the same lag become increasingly correlated at later times (solid line). b, Autocorrelation matrices from MIP and LIP. The 2 × 2 arrangement is identical to the area by effector table in previous figures. To calculate these correlations, an unknown constant, φ, was derived to achieve the best fit to the 15 predicted r values (for details, see Results). Same color map as in a. c, Comparison of autocorrelation value from data (symbols) and theory (lines). These are the top row and first juxtadiagonal as indicated by corresponding line style in a. d, Variance of the rates across trials using the same six time epochs. For a discrete, unbounded diffusion process, these variances should increase linearly as a function of time. The variance estimates use the value of φ derived from the autocorrelation. Note the different scale for the LIP reach graph. Error bars in c and d are SDs obtained from a bootstrap procedure.

Comment in

References

    1. Adelson EH, Bergen JR. Spatiotemporal energy models for the perception of motion. J Opt Soc Am A. 1985;2:284–299. doi: 10.1364/JOSAA.2.000284. - DOI - PubMed
    1. Andersen RA, Cui H. Intention, action planning, and decision making in parietal-frontal circuits. Neuron. 2009;63:568–583. doi: 10.1016/j.neuron.2009.08.028. - DOI - PubMed
    1. Barlow H. The cognitive neurosciences. Cambridge, MA: Massachusetts Institute of Technology; 1995. The neuron doctrine in perception; pp. 415–435.
    1. Batista AP, Buneo CA, Snyder LH, Andersen RA. Reach plans in eye-centered coordinates. Science. 1999;285:257–260. doi: 10.1126/science.285.5425.257. - DOI - PubMed
    1. Bogacz R, Brown E, Moehlis J, Holmes P, Cohen JD. The physics of optimal decision making: a formal analysis of models of performance in two-alternative forced-choice tasks. Psychol Rev. 2006;113:700–765. doi: 10.1037/0033-295X.113.4.700. - DOI - PubMed

Publication types

LinkOut - more resources