. 2015 May 1;290(18):11246-57.
doi: 10.1074/jbc.M114.605410. Epub 2015 Mar 11.

Compartmentalized accumulation of cAMP near complexes of multidrug resistance protein 4 (MRP4) and cystic fibrosis transmembrane conductance regulator (CFTR) contributes to drug-induced diarrhea

Affiliations

Compartmentalized accumulation of cAMP near complexes of multidrug resistance protein 4 (MRP4) and cystic fibrosis transmembrane conductance regulator (CFTR) contributes to drug-induced diarrhea

Changsuk Moon et al. J Biol Chem. .

Abstract

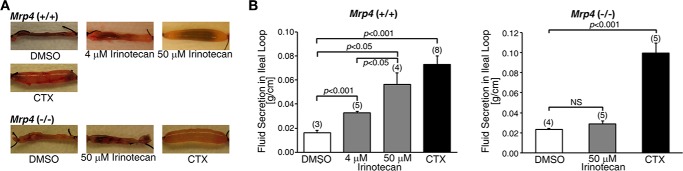
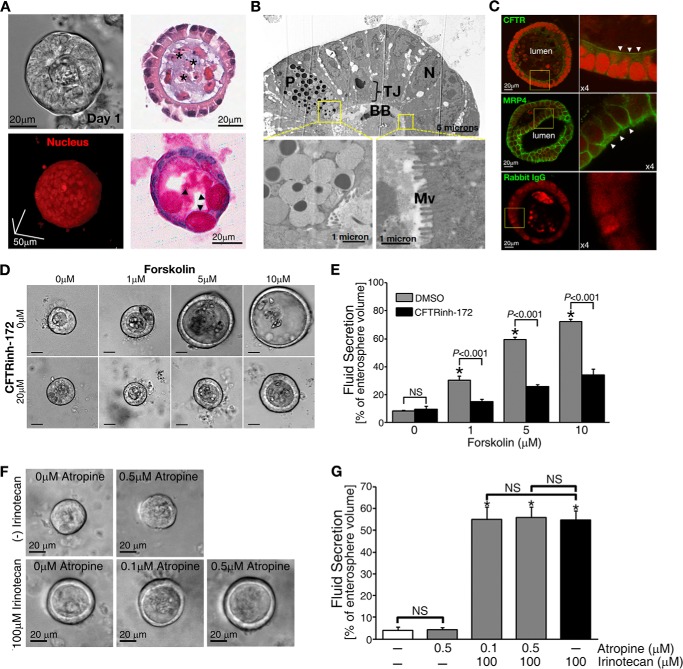
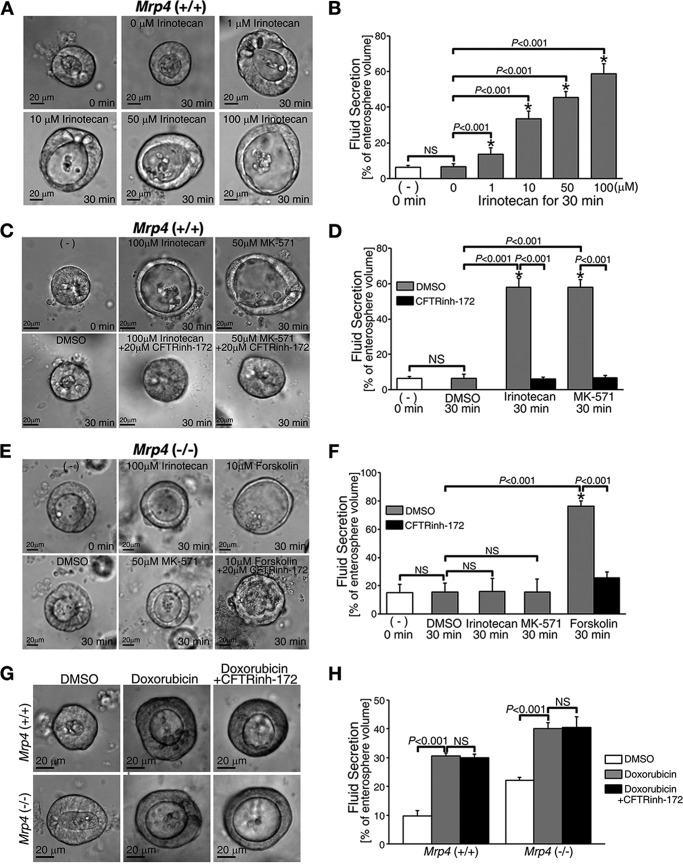
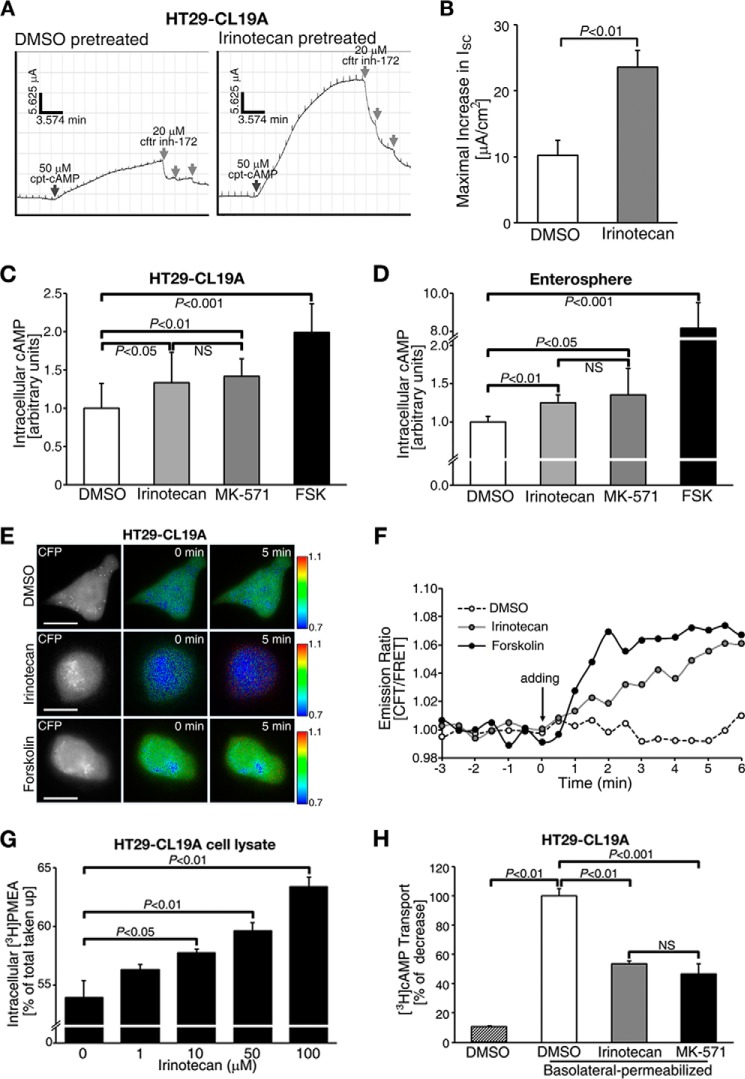
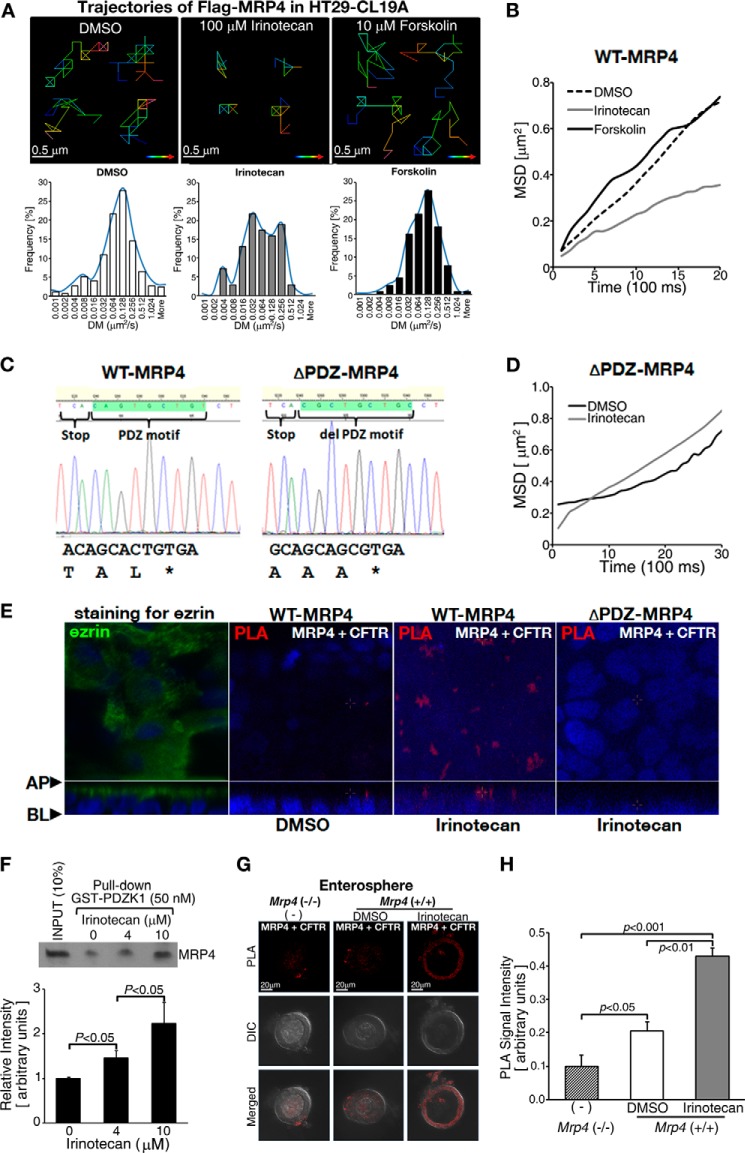
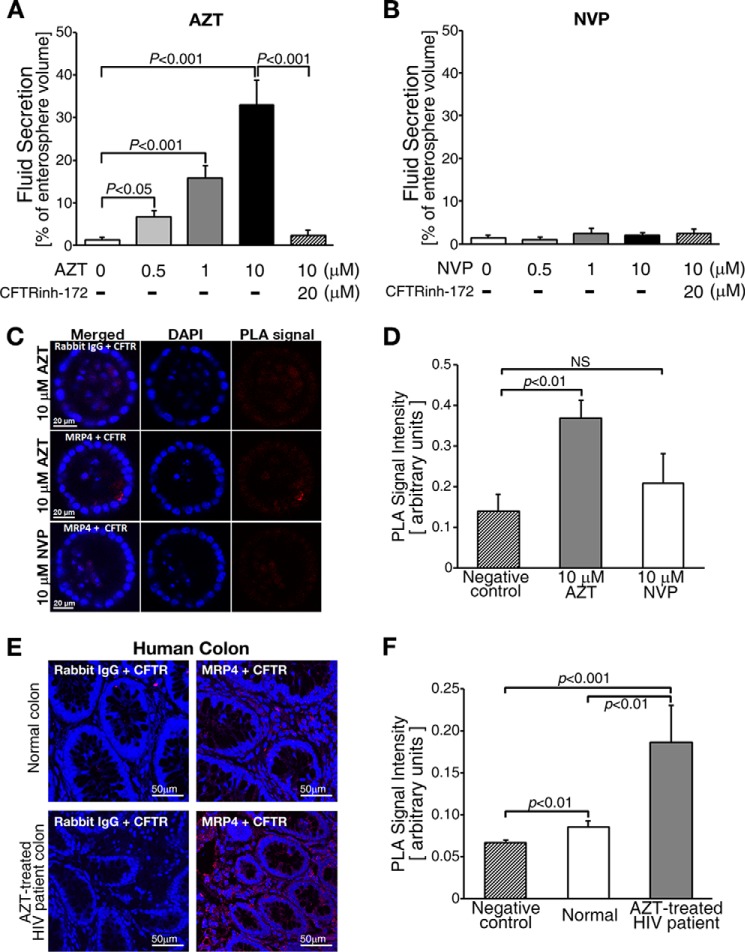
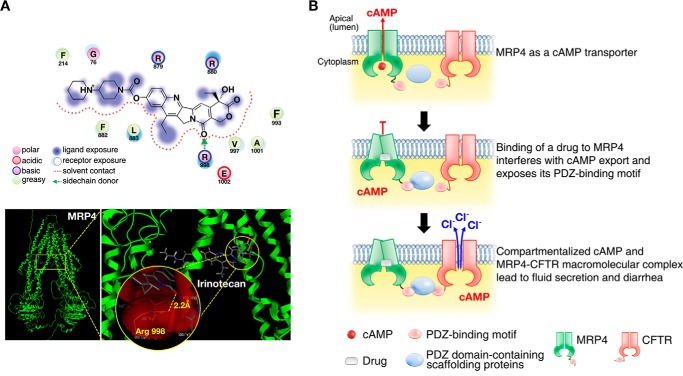
Diarrhea is one of the most common adverse side effects observed in ∼7% of individuals consuming Food and Drug Administration (FDA)-approved drugs. The mechanism of how these drugs alter fluid secretion in the gut and induce diarrhea is not clearly understood. Several drugs are either substrates or inhibitors of multidrug resistance protein 4 (MRP4), such as the anti-colon cancer drug irinotecan and an anti-retroviral used to treat HIV infection, 3'-azido-3'-deoxythymidine (AZT). These drugs activate cystic fibrosis transmembrane conductance regulator (CFTR)-mediated fluid secretion by inhibiting MRP4-mediated cAMP efflux. Binding of drugs to MRP4 augments the formation of MRP4-CFTR-containing macromolecular complexes that is mediated via scaffolding protein PDZK1. Importantly, HIV patients on AZT treatment demonstrate augmented MRP4-CFTR complex formation in the colon, which defines a novel paradigm of drug-induced diarrhea.

Keywords: ABC Transporter; Chloride Channel; Chloride Transport; Cyclic AMP (cAMP); Cystic Fibrosis Transmembrane Conductance Regulator (CFTR); Drug-induced Secretory Diarrhea; Enterosphere; MRP4; Multidrug Transporter; PDZ Domain.


Figures

FIGURE 1.
FIGURE 1.
Irinotecan induced fluid secretion in ileal loops from Mrp4+/+ but not Mrp4−/− mice. A, representative images of ileal loops from the small intestine of Mrp4+/+ and Mrp4−/− mice. The loops were injected with DMSO, irinotecan, or cholera toxin (CTX: positive control). Irinotecan induced fluid secretion in Mrp4+/+ mice in a dose-dependent manner, but failed to induce fluid secretion in Mrp4−/− mice. B, data quantified from experiments as represented in panel A. Data are presented as mean ± S.E. NS, not significant (p ≥ 0.05).
FIGURE 2.
FIGURE 2.
Enterospheres developed from the small intestine of adult mice showed robust CFTR-mediated fluid secretion. A, representative phase-contrast image (upper left) and two-photon micrograph of a three-dimensional cultured enterosphere in Matrigel (lower left). Upper right, histological analysis of enterospheres by HE staining; lower right, periodic acid/Schiff staining. *, luminal area. Arrowheads indicate goblet cells in the enterosphere. B, electron microscope micrographs showing paneth cell (P), brush border (BB), and microvilli (Mv) in the enterosphere (TJ: tight junction; N: nuclei). C, immunohistochemistry staining showing the apical (indicated by arrowheads) localization of CFTR and MRP4 on the enterosphere. Rabbit IgG is used as a negative control. D, forskolin treatment induced CFTR-mediated fluid secretion into the luminal area of the enterospheres in a dose-dependent manner. A specific CFTR channel blocker, CFTRinh-172, inhibited the secretion. Scale bars = 20 μm. E, the data were quantified from experiments as represented in Fig. 1D. F, representative phase-contrast images of fluid secretion in enterospheres from Mrp4+/+ mice in response to irinotecan with or without atropine, an anticholinergic agent. Atropine did not affect irinotecan-increased fluid. G, the data were quantified from experiments as represented in Fig. 1F. All fluid secretion data from enterospheres are presented as the mean ± S.E. (n ≥ 10 enterospheres per group). At least three individual experiments were performed using different mice. *, significant difference as compared with 0 μm irinotecan-treated without atropine group; NS, not significant (p ≥ 0.05).
FIGURE 3.
FIGURE 3.
Irinotecan induced fluid secretion in enterospheres from Mrp4+/+ mice in a dose-dependent manner. Conversely, enterospheres from Mrp4−/− mice were resistant to irinotecan-induced fluid secretion. A, representative phase-contrast images showing fluid secretion in enterospheres from Mrp4+/+ mice in response to irinotecan. Irinotecan induced fluid secretion in a dose-dependent manner. B, quantification of data from experiments as represented in panel A. C, representative phase-contrast images showing fluid secretion in enterospheres from Mrp4+/+ mice in response to irinotecan with or without CFTRinh-172, a CFTR channel blocker. MK-571, an MRP4 inhibitor, was used as a positive control. The irinotecan-induced fluid secretion in enterospheres from Mrp4+/+ mice was CFTR-mediated. D, quantification of data from experiments as represented in panel C. E, representative phase-contrast images showing fluid secretion in enterospheres from Mrp4−/− mice in response to irinotecan, forskolin, or MK-571. Irinotecan and MK-571 failed to induce fluid secretion in these enterospheres. F, quantification of data from experiments as represented in panel E. G, representative phase-contrast images of fluid secretion in enterospheres from Mrp4+/+ and Mrp4−/− mice in response to the anti-cancer drug doxorubicin with or without CFTRinh-172. Doxorubicin, which induces diarrhea during chemotherapy and is not a modulator for MRP4, induced a similar fluid secretion rate in enterospheres from Mrp4+/+ and Mrp4−/− mice (∼2-fold higher as compared with the basal level of secretion in each group) and CFTRinh-172 did not inhibit doxorubicin-induced fluid secretion. H, quantification of data from experiments as represented in panel G. In all bar graphs, the values represent the mean ± S.E. (n ≥ 10 enterospheres per group), and at least three individual experiments were performed using different mice in each panel. *, significant difference from unstimulated group (0 min); NS, not significant (p ≥ 0.05).
FIGURE 4.
FIGURE 4.
Irinotecan augmented CFTR-mediated transepithelial Cl transport by inhibiting the MRP4 efflux pump, thus elevating intracellular cAMP levels at or near the plasma membrane. A, representative traces of CFTR-mediated short-circuit currents (ISC) in response to cpt-cAMP in HT29-CL19A cells pretreated with irinotecan or vehicle (DMSO). Black arrows indicate the addition of cpt-cAMP to activate CFTR; gray arrows indicate the addition of CFTRinh-172. B, quantification of the CFTR-mediated maximal increase in ISC from experiments as represented in panel A. C, irinotecan and MK-571 increased intracellular cAMP levels in HT29-CL19A cells. D, irinotecan and MK-571 increased intracellular cAMP levels in freshly isolated crypts from Mrp4+/+ mice. E, pseudocolor images showing the changes in CFP/FRET emission ratio in HT29-CL19A cells expressing a cAMP sensor (CFP-EPAC-YFP) in response to DMSO, irinotecan, or forskolin. Irinotecan elevated cAMP levels at or near the plasma membrane, whereas forskolin induced a global cAMP response. The fluorescence images were captured from the same field of view. Lookup bars indicate the magnitude of the emission ratio. F, representative line graph showing the changes in CFP/FRET emission ratio in response to DMSO, irinotecan, or forskolin. The arrow indicates the addition of DMSO, irinotecan, or forskolin. The values are representative data in panel E. G, irinotecan inhibited the efflux of [3H]PMEA in a dose-dependent manner in HT29-CL19A cells. H, irinotecan inhibited MRP4-mediated unidirectional transport of [3H]cAMP across the apical plasma membrane of HT29-CL19A cells. The cells were permeabilized at the basolateral side. MK-571 was used as a positive control. In all bar graphs, the values represent the mean ± S.E. (n ≥ 3 independent experiments in each group). NS, not significant (p ≥ 0.05).
FIGURE 5.
FIGURE 5.
Irinotecan enhanced the formation of MRP4-CFTR-containing macromolecular complexes at or near the plasma membrane by increasing the interaction between MRP4 and its binding PDZ protein, PDZK1. A, SPT of FLAG-MRP4 at the plasma membrane. Irinotecan induced a significant decrease of lateral diffusion of MRP4 at the plasma membrane. Upper and lower panels, representative pseudocolor images showing the trajectories of MRP4 in cells treated with DMSO, irinotecan, or forskolin (upper panels) and distribution of diffusion coefficients (DM) for MRP4 particle trajectories (lower panels). Lookup bars indicate the direction of single particle movement (from blue to red). The experiments in each group were performed at least three times, and each individual group had significant differences as compared with the DMSO-treated group (p < 0.05). B, representative mean-squared displacement kinetics (MSD) of FLAG-MRP4 calculated from SPT experiments of DMSO-, irinotecan-, or forskolin-pretreated HT29-CL19A cells. C, DNA sequencing chromatogram showing the C-terminal PDZ motif of wild-type MRP4 and alanine substitution sequences of ΔPDZ-MRP4. D, representative mean-squared displacement kinetics of FLAG-ΔPDZ-MRP4 calculated from SPT experiments of DMSO- or irinotecan-pretreated HT29-CL19A cells. E, confocal images showing PLA signals (red) between MRP4 and CFTR in wild-type MRP4 or ΔPDZ-MRP4-overexpressing HT29-CL19A cells. The cells were polarized and treated with DMSO or irinotecan at the apical side. Anti-MRP4 rabbit polyclonal antibody and anti-CFTR mouse monoclonal antibody were used in the assay. Ezrin (green) is used as an apical marker of polarized HT29-CL19A cells (left panel). The blue fluorescent dye indicates nuclei. AP; apical side, BL; basolateral side. F, MRP4 was pulled down by GST-tagged PDZK1 from HT29-CL19A cells overexpressing MRP4. Irinotecan treatment led to increased interaction between MRP4 and PDZK1 in a dose-dependent manner. The bar graphs show the quantification of the data from blots in the pulldown assay. G, representative micrographs of PLA showing that MRP4 interacts with CFTR (red dots represent PLA signals) in enterospheres from Mrp4+/+ mice. Irinotecan treatment increased PLA signals. Enterospheres from Mrp4 −/− mice were used as a negative control. H, the bar graphs show the quantification of PLA signals from experiments as represented in panel G. The values represent the mean ± S.E. (n ≥ 3 independent experiments in each group).
FIGURE 6.
FIGURE 6.
An FDA-approved drug, AZT, enhanced the formation of MRP4-CFTR-containing macromolecular complexes at or near the plasma membrane. A, AZT increased CFTR-mediated fluid secretion. B, a non-nucleoside reverse-transcriptase inhibitor, NVP, did not induce fluid secretion in enterospheres. The values represent the mean ± S.E. (n ≥ 5 enterospheres per group). C, representative micrographs of the PLA signals (red dots) of MRP4-CFTR interaction in enterospheres from Mrp4+/+ mice and those treated with AZT or NVP. PLA signals were increased in the AZT-treated enterospheres. Rabbit IgG was used as a negative control. D, the bar graphs show the quantification of PLA signals from experiments as represented in panel C. NS, not significant (p ≥ 0.05). E, representative micrographs of PLA signals (red dots) of MRP4-CFTR interaction in human colon from a normal control and an AZT-treated HIV patient. PLA signals were increased in the AZT-treated HIV patient. Rabbit IgG was used as a negative control. F, the bar graphs show the quantification of PLA signals from experiments as represented in panel E. The values represent the mean ± S.E. (n ≥ 5 enterospheres per group). NS, not significant (p ≥ 0.05).
FIGURE 7.
FIGURE 7.
Compartmentalized accumulation of cAMP and MRP4-CFTR-containing macromolecular complexes contributes to drug-induced diarrhea. A, molecular interaction of irinotecan with MRP4. Irinotecan docked to MRP4 as expected, forming one hydrogen bond with the Arg-998 residue of 2.2 Å, and the conformation shows a docking score of −10.975 Kcal/mol (upper panel). Left and right panels, far (left panel) and close-up (right panel) views of docking poses of irinotecan in MRP4 (lower panel). The yellow-dotted line in the circle represents a hydrogen bond between irinotecan and MRP4. Sticks are colored according to atom type: carbon (gray), hydrogen (dark gray), oxygen (red), and nitrogen (blue). B, pictorial representation of a mechanism underlying the irinotecan-induced intestinal fluid secretion (and thus secretory diarrhea) through MRP4-coupled and CFTR-mediated protein-protein interactions. Binding of irinotecan to MRP4 changes MRP4 conformation into a closed pocket and exposes the PDZ motif of MRP4, impairing cAMP efflux across the plasma membrane and enhancing the formation of MRP4-CFTR-containing macromolecular complexes, which accumulates compartmentalized cAMP in proximity to CFTR and hyper-activates its channel function and ultimately causes secretory diarrhea.

References

    1. Chassany O., Michaux A., Bergmann J. F. (2000) Drug-induced diarrhoea. Drug Saf. 22, 53–72 - PubMed
    1. Ratnaike R. N., Jones T. E. (1998) Mechanisms of drug-induced diarrhoea in the elderly. Drugs Aging 13, 245–253 - PubMed
    1. Kunzelmann K., Mall M. (2002) Electrolyte transport in the mammalian colon: mechanisms and implications for disease. Physiol. Rev. 82, 245–289 - PubMed
    1. Schuetz J. D., Connelly M. C., Sun D., Paibir S. G., Flynn P. M., Srinivas R. V., Kumar A., Fridland A. (1999) MRP4: a previously unidentified factor in resistance to nucleoside-based antiviral drugs. Nat. Med. 5, 1048–1051 - PubMed
    1. Pizzolato J. F., Saltz L. B. (2003) The camptothecins. Lancet 361, 2235–2242 - PubMed

Publication types

MeSH terms