. 2015;7(4):375-91.
doi: 10.1159/000370112. Epub 2015 Mar 10.

Autophagy Controls Acquisition of Aging Features in Macrophages

Affiliations

Autophagy Controls Acquisition of Aging Features in Macrophages

Amanda J Stranks et al. J Innate Immun. 2015.

Abstract

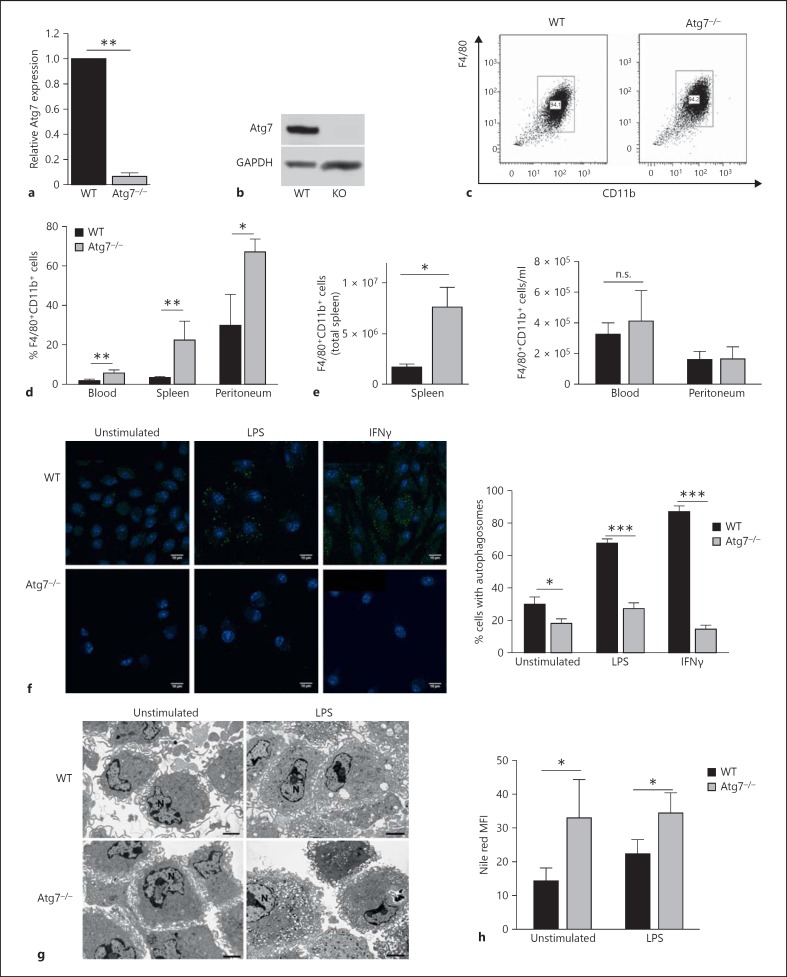
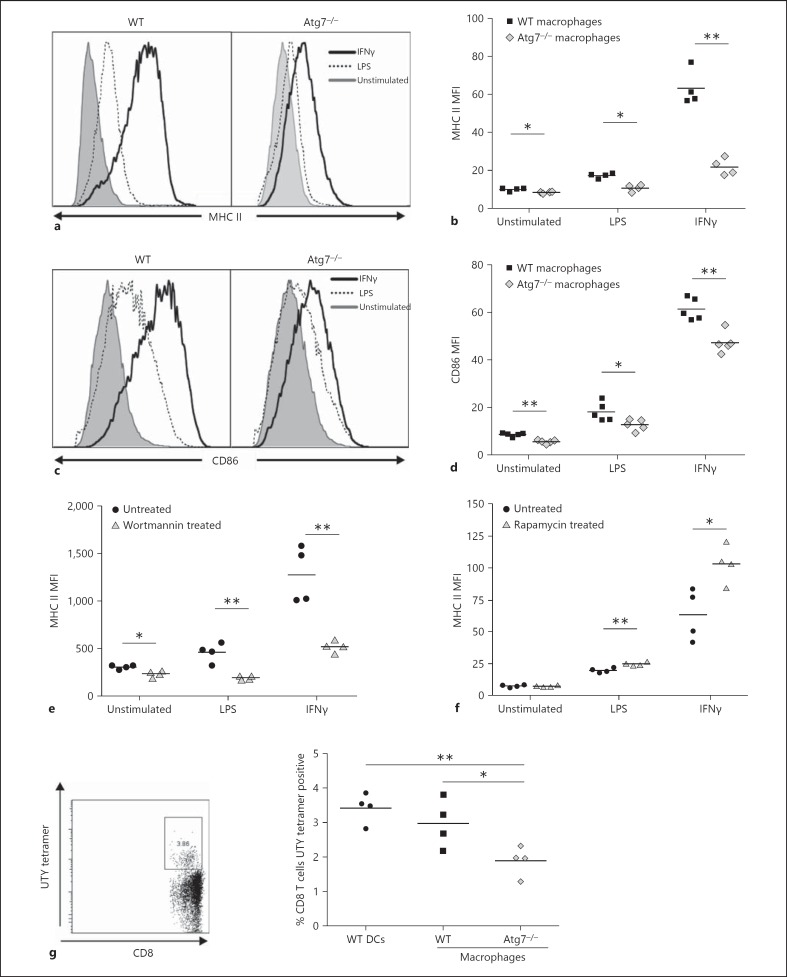
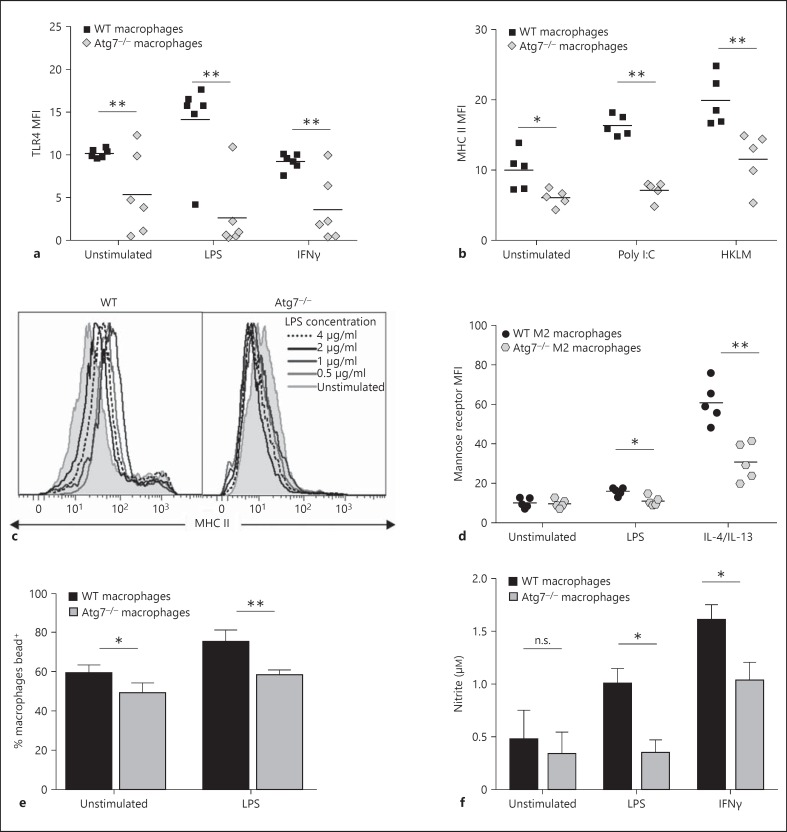
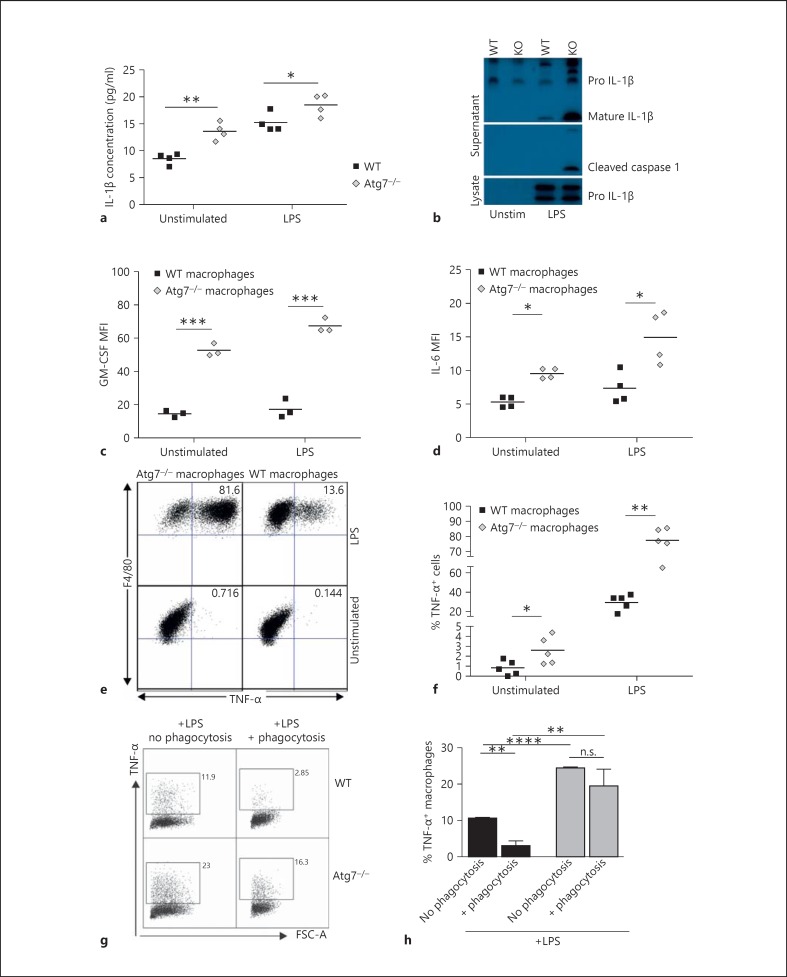
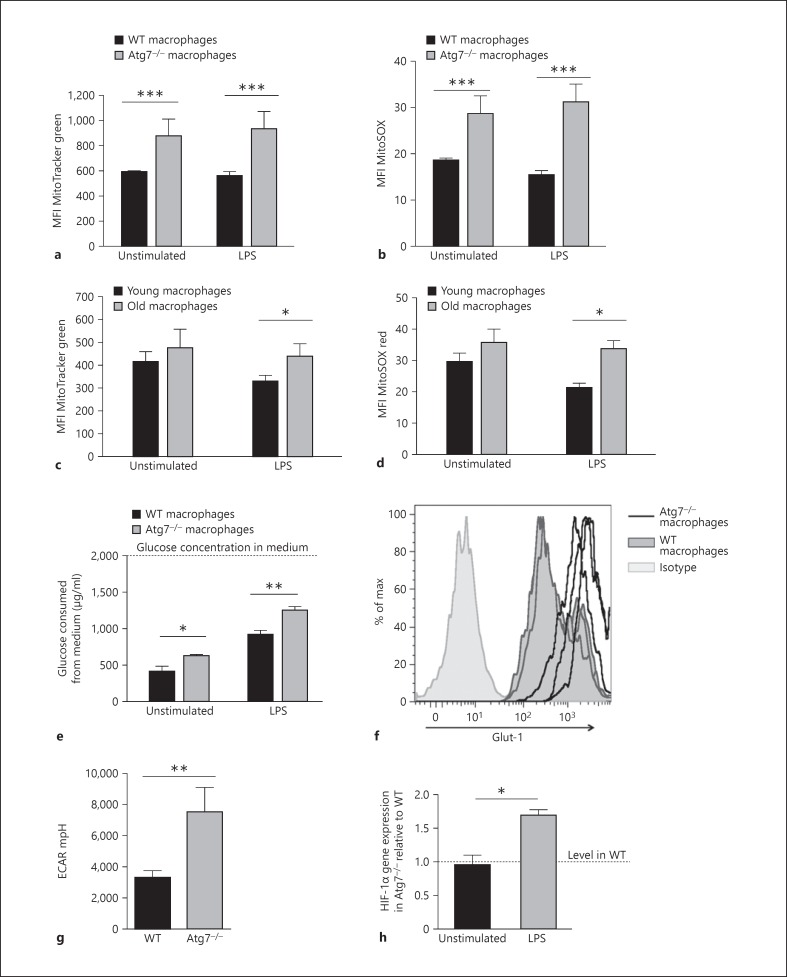
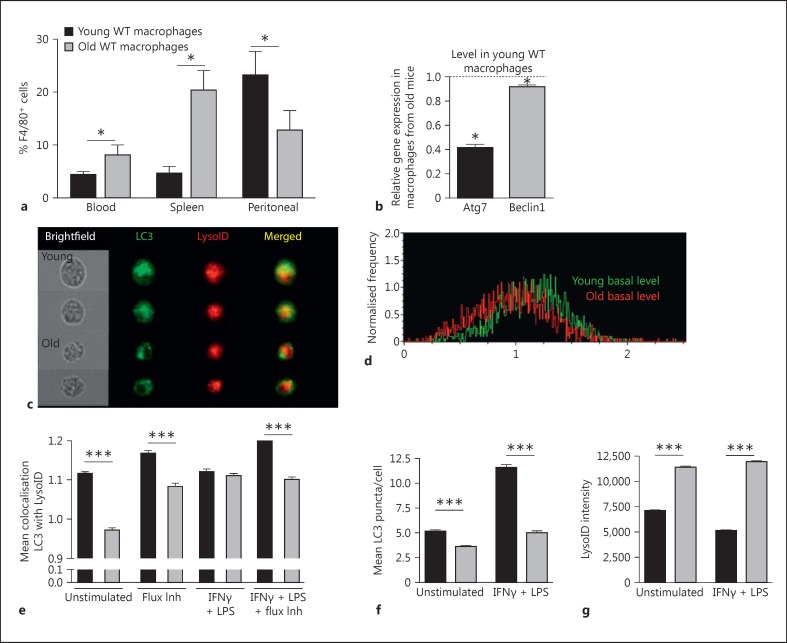
Macrophages provide a bridge linking innate and adaptive immunity. An increased frequency of macrophages and other myeloid cells paired with excessive cytokine production is commonly seen in the aging immune system, known as 'inflamm-aging'. It is presently unclear how healthy macrophages are maintained throughout life and what connects inflammation with myeloid dysfunction during aging. Autophagy, an intracellular degradation mechanism, has known links with aging and lifespan extension. Here, we show for the first time that autophagy regulates the acquisition of major aging features in macrophages. In the absence of the essential autophagy gene Atg7, macrophage populations are increased and key functions such as phagocytosis and nitrite burst are reduced, while the inflammatory cytokine response is significantly increased - a phenotype also observed in aged macrophages. Furthermore, reduced autophagy decreases surface antigen expression and skews macrophage metabolism toward glycolysis. We show that macrophages from aged mice exhibit significantly reduced autophagic flux compared to young mice. These data demonstrate that autophagy plays a critical role in the maintenance of macrophage homeostasis and function, regulating inflammation and metabolism and thereby preventing immunosenescence. Thus, autophagy modulation may prevent excess inflammation and preserve macrophage function during aging, improving immune responses and reducing the morbidity and mortality associated with inflamm-aging.


Figures

Fig. 1
Fig. 1
Atg7-deficient macrophages can be derived normally from bone marrow in vitro. a Deletion of Atg7 in BMMΦ was confirmed by quantitative RT-PCR analysis, normalised to GAPDH. b Atg7 protein is not detectable in Atg7−/- macrophages. Western blot of WT and Atg7−/- macrophage protein extracts. Each lane represents pooled protein extracts from 2 WT or 2 Atg7−/- macrophage cultures. c Atg7−/- BMMΦ express comparable levels of F4/80 and CD11b, and are derived in similar numbers. d Proportions of F4/80+ CD11b+ macrophages in the blood, spleen and peritoneum as detected by flow cytometry. e Absolute counts of F4/80+CD11b+ macrophages in the spleen (left panel), blood and peritoneum (right panel). f LC3+ autophagosomes by immune fluorescence (left images) and proportions of macrophages with LC3+ autophagosomes, 40 cells were counted per slide. g F4/80+ macrophages enriched by MACS for electron microscopy. N = Nucleus. h Nile red staining of lipid droplets in F4/80+CD11b+ BMMΦ as assessed by flow cytometry. FACS plots are representative of >3 experiments. Scale bar = 2 μm.
Fig. 2
Fig. 2
Reduced surface marker expression and antigen presentation in Atg7−/- macrophages. BMMΦ were stimulated overnight with LPS (1 µg/ml) or IFNγ (10 ng/ml) and stained for surface marker expression. a Reduced expression and upregulation of MHC II on Atg7−/- macrophages. b Significantly reduced MHC II expression on Atg7−/- macrophages. c, d CD86 expression is significantly reduced on Atg7−/- macrophages. WT macrophages cultured with wortmannin (100 nM; e) or rapamycin (1 µM; f) for 7 days, stimulated overnight and stained for the surface expression of MHC II. g Male WT and Atg7−/- macrophages and WT DCs (positive control) were injected i.v. into female recipients and male antigen specific CD8+ T cells were detected in recipients' blood using flow cytometry 2 weeks after the injection. UTY tetramer-positive cells shown are CD19 CD8+ cells from a lysed blood sample (left plot), antigen presentation capacity was measured by the percentage of UTY-specific CD8+ T cells present in the blood of female mice (right plot).
Fig. 3
Fig. 3
Reduced innate immune function in Atg7−/- macrophages. BMMΦ were stimulated overnight with LPS (0.5-4 μg/ml), IFNγ (10 ng/ml), poly I:C (1 μg/ml), HKLM (108 particles/well) or IL-4/IL-13 (1 µg each/ml) prior to analysis by flow cytometry. a TLR4 expression on WT and Atg7−/- macrophages. b MHC II expression on WT and Atg7−/- macrophages following stimulation of TLR3 and TLR2 with poly I:C and HKLM, respectively. c Representative histograms of MHC II expression following stimulation with increasing concentrations of LPS. d Mannose receptor expression following M2 stimulation using IL-4 and IL-13. e Phagocytic capacity was assessed by detection of green fluorescent beads taken up by macrophages using flow cytometry. The percentage of macrophages positive for internally located green fluorescence 3 h after the addition of beads to macrophage culture is depicted. f Nitrite concentration was analysed as an indicator of NO production using the Griess reaction.
Fig. 4
Fig. 4
Autophagy-deficient macrophages exhibit high levels of basal inflammation. a ELISA analysis of IL-1β in the supernatant of cultured BMMΦ. b Inflammasome activation in LPS-stimulated macrophages, demonstrated by Western blot analysis of macrophage lysate (loading control) and supernatant. The blot has been cropped for clarity, with all visible bands retained. GM-CSF (c) and IL-6 (d) expression in LPS-stimulated WT and Atg7−/- macrophages assessed by intracellular cytokine staining. e Representative FACS plots of intracellular TNF-α staining. f TNF-α expression is increased in Atg7−/- macrophages, both basally and following LPS stimulation. g TNF-α expression in unstimulated and LPS-stimulated macrophages following phagocytosis of apoptotic thymocytes, with quantification over n = 3 mice in the bar graph (h).
Fig. 5
Fig. 5
Atg7−/- and senescent macrophages have an altered mitochondrial function and metabolism. a Mitochondrial burden in young (8 weeks) WT and Atg7−/- macrophages assessed using MitoTracker Green dye and flow cytometric analysis. b Macrophage mitochondrial superoxide levels in WT and Atg7−/- macrophages were analysed by staining with MitoSOX Red dye and flow cytometry. c Mitochondrial burden in aged macrophages (>100 weeks) as assessed by MitoTracker Green staining. d Mitochondrial superoxide levels in aged macrophages (>100 weeks) were assessed by MitoSOX red staining. e Atg7−/- macrophages utilise higher levels of glucose than WT. The glucose concentration remaining in the media following culture was assessed and subtracted from the initial glucose concentration (2,000 µg/ml) to determine glucose consumption. f Expression of the glucose receptor Glut-1 was assessed by flow cytometry. Histograms from 3 separate WT and Atg7−/- macrophage cultures are shown overlaid. g Atg7−/- peritoneal macrophages have higher levels of glycolysis as assessed by ECAR. h HIF-1α gene expression by qPCR analysis on RNA samples extracted from BMMΦ stimulated overnight with LPS (1 µg/ml).
Fig. 6
Fig. 6
Reduced autophagic flux in aged macrophages. a Frequency of F4/80+ CD11b+ macrophages in blood, spleen and peritoneal suspensions from aged (107 weeks) and young (6 weeks) mice by flow cytometry. b Atg7 and Atg6 gene expression by qPCR analysis on RNA samples extracted from BMMΦ stimulated overnight with LPS (1 µg/ml). c-g BMMΦ were cultured for 7 days and stimulated overnight with IFNγ (10 ng/ml) and LPS (1 μg/ml) then stained for ImageStream, gating for single, live, F4/80-positive cells. c Representative cell images showing brightfield, LC3, LysoID staining. d Representative histograms showing BDS (colocalisation) between LC3 and LysoID. e Mean BDS of LC3/LysoID, with or without IFNγ/LPS treatment and/or autophagic flux inhibition as a positive control via 2 hour E64D (10 μg/ml) and pepstatin A (2 μg/ml) treatment. f Mean LC3 puncta per cell; spots were quantified via ImageStream. g LysoID mean intensity in macrophages following the indicated treatment.

References

    1. Rubinsztein DC, Marino G, Kroemer G. Autophagy and aging. Cell. 2011;146:682–695. - PubMed
    1. Pyo JO, Yoo SM, Ahn HH, Nah J, Hong SH, Kam TI, Jung S, Jung YK. Overexpression of Atg5 in mice activates autophagy and extends lifespan. Nat Commun. 2013;4:2300. - PMC - PubMed
    1. Nixon RA. The role of autophagy in neurodegenerative disease. Nat Med. 2013;19:983–997. - PubMed
    1. Mortensen M, Soilleux EJ, Djordjevic G, Tripp R, Lutteropp M, Sadighi-Akha E, Stranks AJ, Glanville J, Knight S, Jacobson SE, Kranc KR, Simon AK. The autophagy protein Atg7 is essential for hematopoietic stem cell maintenance. J Exp Med. 2011;208:455–467. - PMC - PubMed
    1. Degenhardt K, Mathew R, Beaudoin B, Bray K, Anderson D, Chen G, Mukherjee C, Shi Y, Gelinas C, Fan Y, Nelson DA, Jin S, White E. Autophagy promotes tumor cell survival and restricts necrosis, inflammation, and tumorigenesis. Cancer Cell. 2006;10:51–64. - PMC - PubMed

Publication types

Substances