. 2015 May 26;43(10):e69.
doi: 10.1093/nar/gkv180. Epub 2015 Mar 12.

Accurate read-based metagenome characterization using a hierarchical suite of unique signatures

Affiliations

Accurate read-based metagenome characterization using a hierarchical suite of unique signatures

Tracey Allen K Freitas et al. Nucleic Acids Res. .

Abstract

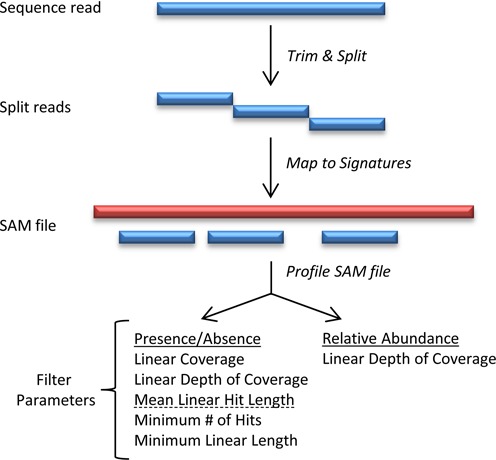
A major challenge in the field of shotgun metagenomics is the accurate identification of organisms present within a microbial community, based on classification of short sequence reads. Though existing microbial community profiling methods have attempted to rapidly classify the millions of reads output from modern sequencers, the combination of incomplete databases, similarity among otherwise divergent genomes, errors and biases in sequencing technologies, and the large volumes of sequencing data required for metagenome sequencing has led to unacceptably high false discovery rates (FDR). Here, we present the application of a novel, gene-independent and signature-based metagenomic taxonomic profiling method with significantly and consistently smaller FDR than any other available method. Our algorithm circumvents false positives using a series of non-redundant signature databases and examines Genomic Origins Through Taxonomic CHAllenge (GOTTCHA). GOTTCHA was tested and validated on 20 synthetic and mock datasets ranging in community composition and complexity, was applied successfully to data generated from spiked environmental and clinical samples, and robustly demonstrates superior performance compared with other available tools.


Figures

Figure 1.
Figure 1.
Overview of GOTTCHA workflow. Raw sequence reads are first cut on low quality bases and split into non-overlapping 30 bp fragments (see ‘Materials and Methods’ section). Read fragments are then mapped to a GOTTCHA database, after which the GOTTCHA profiler parses the alignment file and generates the community composition along with their relative abundances.
Figure 2.
Figure 2.
Comparison of classification and abundance profiles for two HCHC synthetic metagenomes. Species-level results for an evenly (MG1: panels A, B) and log-normally distributed (MG2: panels C, D) high complexity (n = 100) synthetic metagenome with high coverage (300M 100-bp paired-end reads) simulating one HiSeq lane. Bar charts (panels A, C) plot the sum of the binary classification results (TP + FP + FN) for each tool. A perfect classification would yield a solid maroon bar with TP = 100, FN = 0 and FP = 0. Line-and-scatter plots (panels B, D) show the relative errors in abundance calculations for each tool. Points at the zero-line predicted abundances perfectly. Those above and below are over- and under-predicted abundances, respectively, and points at −1 represent organisms the tool failed to identify.
Figure 3.
Figure 3.
Comparison of classification and abundance profiles for the HMP mock samples. Classification and abundance performance results were generated for the Illumina even (MG17: panels A, C), Illumina staggered (MG18: panels E, G), 454 even (MG19: panels B, D) and 454 staggered (MG20: panels F, H) HMP data sets (see ‘Materials and Methods’ section). Interpretation of the bar chart and line-and-scatter plots are similar to that in Figure 2. Bar charts plot the sum of the binary classification results (TP + FP + FN) for each tool. A perfect classification would yield a solid maroon bar with TP = 20, FN = 0 and FP = 0.
Figure 4.
Figure 4.
Pathogen identification in a clinical human fecal microbiome sample. Each of three aliquots from a single human fecal source was spiked with five pathogens at varying titers such that each successive titer differed 10-fold from the previous one. The range of organisms identified in the heat map (panel A) were truncated down to the 38 bacteria (upper panel) and eight viruses identified by GOTTCHA. Spike in concentrations (titers #1/2/3): B. anthracis, 108/107/106 CFU/ml; Y. pestis, 106/107/108 CFU/ml; Adenovirus (4.07 × 10⁸ genome copies/ml), 1:50/1:500/1:5000 dilutions; Poliovirus (4.14 × 10⁹ genome copies/ml), 1:50000/1:5000/1:500 dilutions; Astrovirus (5.83 × 10⁹ genome copies/ml), 1:50/1:500/1:5000 dilutions. Relative abundances range from 2.7 × 10⁻⁸ (black) to 0.0052 (red), while gray cells indicate absence. Neither MetaPhlAn nor mOTUs can predict viral presence, therefore they are marked as absent (lower panel). Spiked-in pathogens are identified with a dagger (†). The total number of hits recovered for each pathogen at each titer is shown in the bar plot (panel B) and labeled where most concentrated above the bar in the triplet. Absent data points were below GOTTCHA detection thresholds and marked with asterisks (*). Pathogenic strains: Y. pestis (A1122 vaccine strain), B. anthracis (Sterne vaccine strain), Human adenovirus B (HAdV-3 strain), Mamastrovirus 1 (Human astrovirus 2), and Enterovirus C (Human poliovirus 1 strain Sabin vaccine strain).

References

    1. Degnan P.H., Ochman H. Illumina-based analysis of microbial community diversity. ISME J. 2012;6:183–194. - PMC - PubMed
    1. Petrosino J.F., Highlander S., Luna R.A., Gibbs R.A., Versalovic J. Metagenomic pyrosequencing and microbial identification. Clin. Chem. 2009;55:856–866. - PMC - PubMed
    1. Scholz M.B., Lo C.C., Chain P.S.G. Next generation sequencing and bioinformatic bottlenecks: the current state of metagenomic data analysis. Curr. Opin. Biotech. 2012;23:9–15. - PubMed
    1. Hatem A., Bozdag D., Toland A.E., Catalyurek U.V. Benchmarking short sequence mapping tools. BMC Bioinform. 2013;14:184. - PMC - PubMed
    1. Schbath S., Martin V., Zytnicki M., Fayolle J., Loux V., Gibrat J.F. Mapping reads on a genomic sequence: An algorithmic overview and a practical comparative analysis. J. Comput. Biol. 2012;19:796–813. - PMC - PubMed

Publication types