. 2015 Feb 18;16(1):97.
doi: 10.1186/s12864-015-1308-8.

A comprehensive evaluation of ensembl, RefSeq, and UCSC annotations in the context of RNA-seq read mapping and gene quantification

Affiliations

A comprehensive evaluation of ensembl, RefSeq, and UCSC annotations in the context of RNA-seq read mapping and gene quantification

Shanrong Zhao et al. BMC Genomics. .

Abstract

Background: RNA-Seq has become increasingly popular in transcriptome profiling. One aspect of transcriptome research is to quantify the expression levels of genomic elements, such as genes, their transcripts and exons. Acquiring a transcriptome expression profile requires genomic elements to be defined in the context of the genome. Multiple human genome annotation databases exist, including RefGene (RefSeq Gene), Ensembl, and the UCSC annotation database. The impact of the choice of an annotation on estimating gene expression remains insufficiently investigated.

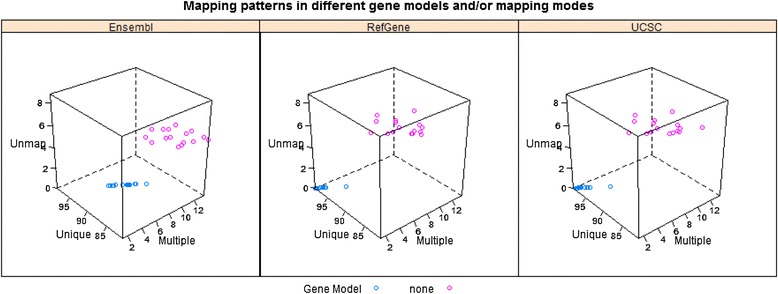
Results: In this paper, we systematically characterized the impact of genome annotation choice on read mapping and transcriptome quantification by analyzing a RNA-Seq dataset generated by the Human Body Map 2.0 Project. The impact of a gene model on mapping of non-junction reads is different from junction reads. For the RNA-Seq dataset with a read length of 75 bp, on average, 95% of non-junction reads were mapped to exactly the same genomic location regardless of which gene models was used. By contrast, this percentage dropped to 53% for junction reads. In addition, about 30% of junction reads failed to align without the assistance of a gene model, while 10-15% mapped alternatively. There are 21,958 common genes among RefGene, Ensembl, and UCSC annotations. When we compared the gene quantification results in RefGene and Ensembl annotations, 20% of genes are not expressed, and thus have a zero count in both annotations. Surprisingly, identical gene quantification results were obtained for only 16.3% (about one sixth) of genes. Approximately 28.1% of genes' expression levels differed by 5% or higher, and of those, the relative expression levels for 9.3% of genes (equivalent to 2038) differed by 50% or greater. The case studies revealed that the gene definition differences in gene models frequently result in inconsistency in gene quantification.

Conclusions: We demonstrated that the choice of a gene model has a dramatic effect on both gene quantification and differential analysis. Our research will help RNA-Seq data analysts to make an informed choice of gene model in practical RNA-Seq data analysis.


Figures

Figure 1
Figure 1
The read mapping summary for 16 tissue samples in the “transcriptome only” and “transcriptome+genome” mapping modes (note: read length=75 bp). In the “transcriptome only” mode, more reads are mapped in Ensembl than in RefGene and UCSC (left panel), and more reads become multiple-mapped in Ensembl than in RefGene and UCSC (right panel). Note: the gene model “none” means the RNA-Seq reads are mapped to the reference genome directly without the use of a gene model.
Figure 2
Figure 2
The effect of a gene model on the mapping summaries for 16 tissue samples (read length=75 bp). The RefGene and UCSC consistently have the highest percentage of uniquely mapped reads; while the percentage of non-uniquely mapped reads is much higher in Ensembl. Without a gene model (indicated in pink) in the mapping step, a constant 6% of reads become unmapped.
Figure 3
Figure 3
The impact of a gene model on RNA- Seq read mapping (read length=75 bp). (A) composition of mapped reads: roughly 23% are junction reads, and the rest 77% are non-junction reads; (B) effect on mapping of non-junctions reads: on average, 95% remain mapped to exactly the same genomic location, whilst 3–9% of reads become multiple-mapped reads; (C) effect on mapping of junctions reads: an average of 53% of reads remain mapped to the same genomic regions without the assistance of a gene model. About 30% of junction reads fail to be mapped, while 10–15% map alternatively. (Note: the 16 tissue sample names are denoted as follows: a: adipose; b: adrenal, c: brain; d: breast; e: colon; f: heart; g: kidney; h: leukocyte; i: liver; j: lung; k: lymph node; l: ovary; m: prostate; n: skeletal muscle; o: testis; and p: thyroid).
Figure 4
Figure 4
The overlap and intersection among RefGene, UCSC, and Ensembl annotations. In general, different annotations have very high overlaps: there are 21,598 common genes shared by all three gene models. RefGene has the fewest unique genes, while more than 50% of genes in Ensembl are unique.
Figure 5
Figure 5
The correlation of gene quantification results between RefGene and Ensembl. Both x and y-axes represent Log2(count + 1). Although the majority of genes have highly consistent or nearly identical expression levels, there are many genes whose quantification results are dramatically affected by the choice of a gene model.
Figure 6
Figure 6
The different gene definitions for PIK3CA give rise to differences in gene quantification. PIK3CA in the Ensembl annotation is much longer than its definition in RefGene, explaining why there are 1094 reads mapped to PIK3CA in Ensembl, while only 492 reads are mapped in RefGene. The PIK3CA gene definition in Ensembl seems more accurate than the one in RefGene, based upon the mapping profile of sequence reads.
Figure 7
Figure 7
The different gene definitions for LUZP6. In the Ensembl annotation, LUZP6 is only 177 bp long, and it is completely within another gene, MTPN. As a result, all sequence reads originating from LUZP6 are assigned to MTPN instead. In RefGene, LUZP6 and MTPN are derived from the same genomic region, and both encode exactly the same mRNA, though the protein coding sequences are different. Therefore, all reads mapped to this region are equally distributed between these two genes.
Figure 8
Figure 8
The correlation of the calculated Log2Ratio (heart/ liver) between RefGene and Ensembl. The green, blue, and red points indicate corresponding absolute difference between the two Log2Ratios that were greater than 1, 2, or 5, respectively. Although the majority of genes have highly consistent expression changes, there are many genes that are remarkably affected by the choice of different gene models.
Figure 9
Figure 9
Analysis protocol. (A) The mapping result for a sequence read that is gene model dependent, where none of the gene models are complete; (B) “two-stage” mapping protocol: at Stage #1, all RNA-Seq reads are mapped to a reference transcriptome only, and then only the mapped reads are saved into a new FASTQ file; at Stage #2, those remaining reads are mapped to the genome with and without the use of a gene model in the mapping step; (C) The protocol for classifying uniquely mapped sequence reads into four categories, i.e., “Identical”, “Alternative”, “Multiple” and “Unmapped” (or Fail).

References

    1. Mortazavi A, Williams BA, McCue K, Schaeffer L, Wold B. Mapping and quantifying mammalian transcriptomes by RNA-Seq. Nat Methods. 2008;5(7):621–8. doi: 10.1038/nmeth.1226. - DOI - PubMed
    1. Montgomery SB, Sammeth M, Gutierrez-Arcelus M, Lach RP, Ingle C, Nisbett J, et al. Transcriptome genetics using second generation sequencing in a caucasian population. Nature. 2010;464(7289):773–7. doi: 10.1038/nature08903. - DOI - PMC - PubMed
    1. Pan Q, Shai O, Lee LJ, Frey BJ, Blencowe BJ. Deep surveying of alternative splicing complexity in the human transcriptome by high-throughput sequencing. Nat Genet. 2008;40(12):1413–5. doi: 10.1038/ng.259. - DOI - PubMed
    1. Wang Z, Gerstein M, Snyder M. RNA-Seq: a revolutionary tool for transcriptomics. Nat Rev Genet. 2009;10(1):57–63. doi: 10.1038/nrg2484. - DOI - PMC - PubMed
    1. Mutz KO, Heilkenbrinker A, Lönne M, Walter JG, Stahl F. Transcriptome analysis using next-generation sequencing. Curr Opin Biotechnol. 2013;24(1):22–30. doi: 10.1016/j.copbio.2012.09.004. - DOI - PubMed

LinkOut - more resources