. 2015 Feb 19;16(1):99.
doi: 10.1186/s12864-015-1247-4.

H2A.Z marks antisense promoters and has positive effects on antisense transcript levels in budding yeast

Affiliations

H2A.Z marks antisense promoters and has positive effects on antisense transcript levels in budding yeast

Muxin Gu et al. BMC Genomics. .

Abstract

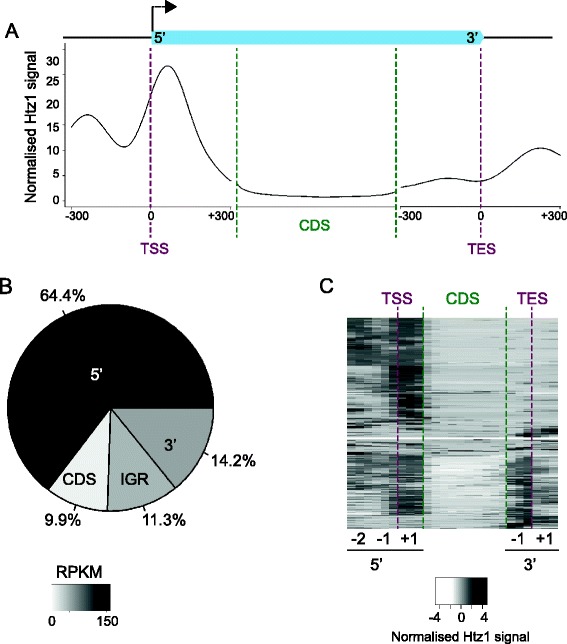
Background: The histone variant H2A.Z, which has been reported to have both activating and repressive effects on gene expression, is known to occupy nucleosomes at the 5' ends of protein-coding genes.

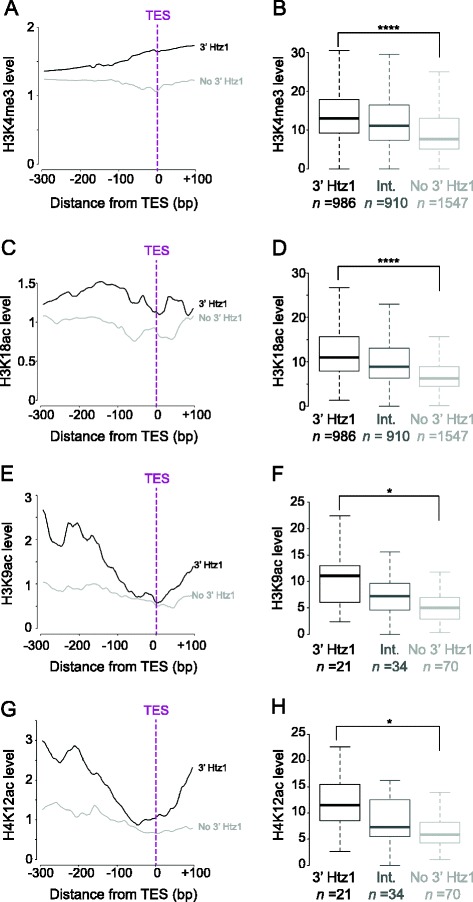
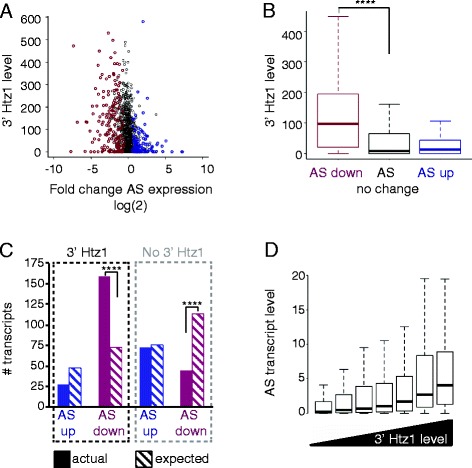
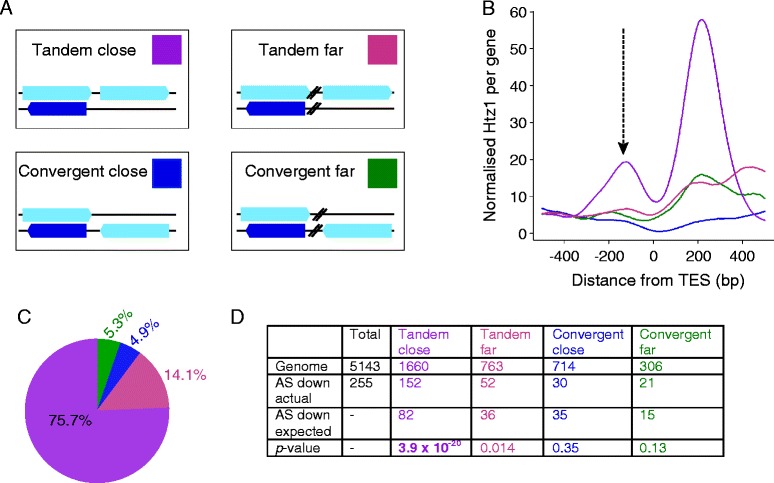
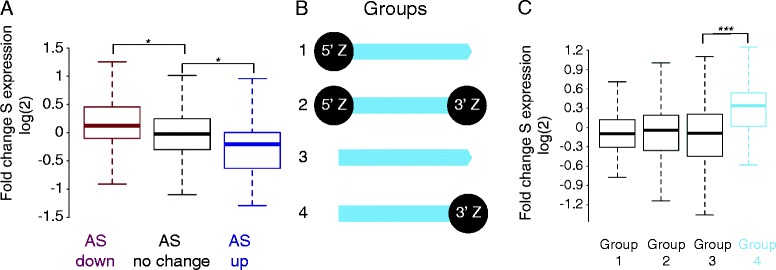
Results: We now find that H2A.Z is also significantly enriched in gene coding regions and at the 3' ends of genes in budding yeast, where it co-localises with histone marks associated with active promoters. By comparing H2A.Z binding to global gene expression in budding yeast strains engineered so that normally unstable transcripts are abundant, we show that H2A.Z is required for normal levels of antisense transcripts as well as sense ones. High levels of H2A.Z at antisense promoters are associated with decreased antisense transcript levels when H2A.Z is deleted, indicating that H2A.Z has an activating effect on antisense transcripts. Decreases in antisense transcripts affected by H2A.Z are accompanied by increased levels of paired sense transcripts.

Conclusions: The effect of H2A.Z on protein coding gene expression is a reflection of its importance for normal levels of both sense and antisense transcripts.


Figures

Figure 1
Figure 1
About one-third of Htz1 is localised outside of TSSs. A. Average profile of Htz1 at protein-coding genes, with an average transcript depicted by a light blue box. Genes were aligned according to their TSSs or transcription end sites (TESs) and the average levels of Htz1 (reads per million sequenced reads per gene) were calculated for each base pair. For relative alignments of coding regions (CDS; region >300 bp down/up-stream of TSS/TES), all transcripts were stretched or compressed to a constant length and then the average Htz1 level was found at each relative position. B. The percentages of Htz1 signal located at the 5' end (−300 to +300 relative to TSS), CDS, and 3' end (−300 to +300 relative to TES) of protein-coding genes are shown, along with enrichment in other intergenic regions (IGR; > 300 bp away from a protein coding gene). The darkness of the colour for each category reflects the length-normalised density of Htz1 signal in reads per kilobase per million mapped reads (RPKM). C. Hierarchical clustering of Htz1 binding profiles, highlighting the clusters of genes with Htz1 enrichment at TSSs, CDSs and TESs. A 25-dimensional vector was generated for each transcript, comprising nine 50-bp windows corresponding to the −2, −1 and +1 nucleosomes around the TSS (5' -2, 5' -1 & 5' +1), 10 windows for the coding sequence (CDS) and six 50-bp windows for the nucleosomes flanking the TES (3' -1; 3' +1). Clustering was done using Euclidean distances between the vectors. Data in this figure were generated from one biological replicate, but are essentially identical to a second wild-type biological replicate (Additional file 5: Table S1).
Figure 2
Figure 2
Htz1 at 3′ ends of genes co-localises with active histone modifications. Histone modifications known to occupy active promoters include H3K4me3 [19], H3K18ac [20], H3K9ac and H4K12ac [18]. H4K4me3 and H3K18ac data are from the whole genome; H3K9ac and H4K12ac are restricted to chromosome 3. A, C, E, G. Profiles of histone modifications at the 3' ends of genes with 3' Htz1 enrichment (black lines) or without Htz1 enrichment (grey lines). All four active histone marks are enriched upstream of the TESs of genes that have high 3' Htz1 occupancy. B, D, F, H. Boxplots of the distributions of histone modification levels in genes with high 3' Htz1 enrichment (3' Htz1; black boxes), without Htz1 enrichment (no 3' Htz1; light grey boxes) or with intermediate levels of 3' Htz1 (Int.; medium grey boxes). The number of genes in each category is indicated. H3K4me3 (p = 4.0 x 10⁻²⁹), H3K18ac (p = 8.0 x 10−57), H3K9ac (p = 6.4 x 10⁻³) and H4K12ac (p = 1.2 x 10⁻²) are significantly higher on genes with high 3' Htz1. *p ≤ 0.05, ****p ≤ 0.0001. The p-values were obtained using two-tailed t-tests.
Figure 3
Figure 3
Htz1 at 3′ ends marks the start of antisense transcripts. A. Transcripts derived from the + and – strands are shown, along with Htz1 occupancy over the same regions for the protein coding genes YCR059C, YBR128C, YJR096W, YBR019C and YBR020W. Antisense (AS) transcripts are coloured dark blue and sense (S) transcripts light blue. Htz1 ChIP peaks at the 3' ends of protein-coding transcripts are co-incident with the 5' ends of antisense transcripts, as indicated by the arrows. B. Fraction of genes with (top) or without (bottom) 3' Htz1 that have associated antisense transcripts. 537 (52%) out of 1025 genes that have a high level of 3' Htz1 are associated with antisense transcripts whereas only 155 (5%) out of 3010 genes with no 3' Htz1 have antisense transcripts. C. Number of 3' end regions associated with antisense transcripts. Out of the 1025 genes whose 3' ends are occupied by high levels of Htz1, 537 are associated with antisense transcripts, which is significantly higher than the expected 185 (****p ≤ 0.0001 (1.7 x 10−187), Fisher’s exact test), whereas out of the 3010 genes whose 3' ends are depleted of Htz1 only 155 are associated with antisense transcripts, which is significantly lower than the expected 542 (****p ≤ 0.0001 (3.6 x 10−184), Fisher’s exact test). D. Comparison of the number of 3' Htz1 peaks associated with antisense transcripts (green line) to the distribution of random 3' regions (black bars) that co-localise with antisense transcripts. 987 regions of 150 bp were drawn randomly from the 3' ends of genes and the number co-localising with antisense transcripts was calculated. This randomisation was performed 1000 times to produce the histogram showing the distribution of random peaks that co-localise with antisense transcripts. The actual association of Htz1 with antisense transcripts is highly significant (p = 0).
Figure 4
Figure 4
Htz1 affects antisense transcript levels. A. Comparison of differential antisense (AS) transcript levels in rrp6∆htz1∆∆ versus rrp6∆ to Htz1 levels at the 3' ends of genes. Each transcript is shown as an open circle, with its 3' Htz1 level measured by ChIP-seq being the y-value and its fold change of expression in the rrp6∆htz1∆ strain shown as its x-value. Significantly up- and down-regulated transcripts are coloured in blue and magenta respectively. B. Boxplots of the distributions of 3' Htz1 levels for down- (n = 255) and up- (n = 169) regulated antisense transcripts show that down-regulated antisense transcripts are significantly enriched for Htz1 (****p ≤ 0.0001 (2.9 x 10⁻²¹); two-tailed t-test) compared to transcripts whose expression doesn’t change (n = 3019). C. Actual (solid bars) and expected (hatched bars) number of up-/down-regulated antisense transcripts with and without 3' Htz1. Down-regulated antisense transcripts with 3' Htz1 are significantly more numerous than expected (****p ≤ 0.0001 (1.0 x 10⁻³¹); Fisher’s exact test), whereas those without 3' Htz1 are significantly fewer than expected (****p ≤ 0.0001 (1.6 x 10⁻²¹); Fisher’s exact test). D. Enrichment of Htz1 at the 3' end of genes positively correlates with the level of the associated antisense transcript. Genes were classified into bins of seven quantiles according to 3' Htz1 level. The distribution of antisense transcript levels are plotted for each bin, arranged from low 3' Htz1 (left) to high 3' Htz1 (right).
Figure 5
Figure 5
Htz1 predominantly affects tandemly arranged sense/antisense genes. A. Genomic arrangement of the 4 gene categories, with sense transcripts depicted as light blue boxes on the + or – strand and antisense transcripts shown as dark blue boxes. Tandem or convergent refers to the sense transcripts. Close genes have <300 bp between them, while the distance is >300 bp for the “far” genes. The coloured box for each category is the key for B, C & D. B. Htz1 levels at the 3' ends of genes, aligned by TESs and coloured according to A. The arrow indicates the 3' peak upstream of the TES that we have focused on. Convergent genes have less Htz1 associated with their 3' ends, with “tandem close” genes having the highest Htz1 levels. C. Quantification of the 3' Htz1 signal shows that the majority of 3' Htz1 is found at tandem genes. D. Htz1 affects a significant number of tandem close antisense transcripts. The number of antisense transcripts down-regulated in rrp6∆htz1∆ was compared to the number in that category in the genome for each of the 4 gene arrangements. The p values are derived from Fisher’s exact tests.
Figure 6
Figure 6
The effect of Htz1 on antisense transcript levels impacts sense transcripts. A. Genes with 3' Htz1 enrichment and an antisense transcript were divided into three groups based on whether their antisense transcript levels were unchanged (n = 794), up- (n = 28) or down- (n = 159) regulated in rrp6∆htz1∆. The boxplots show changes in sense (S) transcript levels for these groups. Down-regulated antisense transcripts have a significantly higher fold change in sense expression (*p ≤ 0.05 (0.02), two-tailed t-test) and conversely sense transcript levels are significantly decreased when antisense transcripts are up-regulated (*p ≤ 0.05 (0.05), two-tailed t-test). B. Classification of genes with both sense and antisense transcripts according to 5' and 3' enrichment of Htz1 was performed using thresholds for 5' and 3' enrichment based on average Htz1 occupancies at the 5' and 3' ends. Class 1 (n = 110) have only 5' enrichment; class 2 (n = 237) have 5' and 3' enrichment; class 3 (n = 75) are not enriched for Htz1 at either 5' or 3' ends; and class 4 (n = 34) have Htz1 only at the 3' end. C. Distributions of sense transcript fold changes in the rrp6∆htz1∆ strain for each of the classes of genes illustrated in B. Sense transcripts are significantly up-regulated in group 4 genes that have Htz1 at their 3' ends only (***p ≤ 0.001 (7.5 x 10⁻⁴), two-tailed t-test).

References

    1. Millar CB. Organizing the genome with H2A histone variants. Biochem J. 2013;449:567–79. doi: 10.1042/BJ20121646. - DOI - PubMed
    1. Meneghini MD, Wu M, Madhani HD. Conserved histone variant H2A.Z protects euchromatin from the ectopic spread of silent heterochromatin. Cell. 2003;112:725–36. doi: 10.1016/S0092-8674(03)00123-5. - DOI - PubMed
    1. Kumar SV, Wigge PA. H2A.Z-Containing Nucleosomes Mediate the Thermosensory Response in Arabidopsis. Cell. 2010;140:136–47. doi: 10.1016/j.cell.2009.11.006. - DOI - PubMed
    1. Creyghton MP, Markoulaki S, Levine SS, Hanna J, Lodato MA, Sha K, et al. H2AZ Is Enriched at Polycomb Complex Target Genes in ES Cells and Is Necessary for Lineage Commitment. Cell. 2012;135:1–13. - PMC - PubMed
    1. Updike DL, Mango SE. Temporal Regulation of Foregut Development by HTZ-1/H2A.Z and PHA-4/FoxA. PLoS Genet. 2006;2:1500–10. doi: 10.1371/journal.pgen.0020161. - DOI - PMC - PubMed

Publication types

MeSH terms