Review
. 2015 Mar 13;347(6227):aaa4339.
doi: 10.1126/science.aaa4339.

Modeling infectious disease dynamics in the complex landscape of global health

Collaborators, Affiliations
Review

Modeling infectious disease dynamics in the complex landscape of global health

Hans Heesterbeek et al. Science. .

Abstract

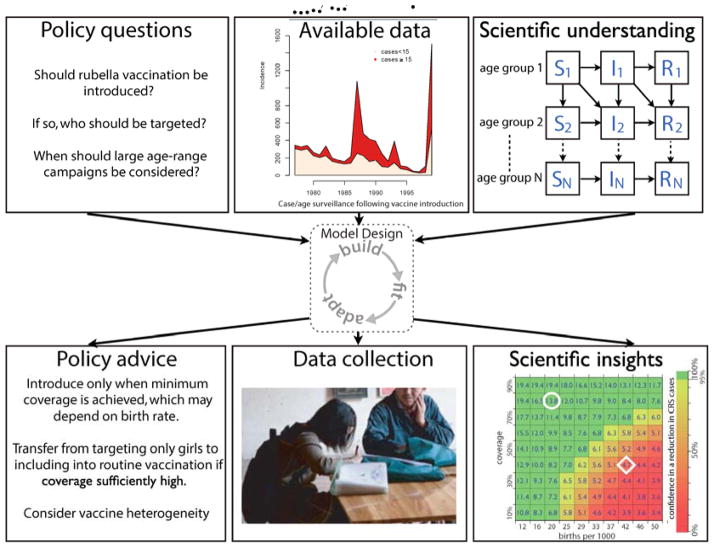
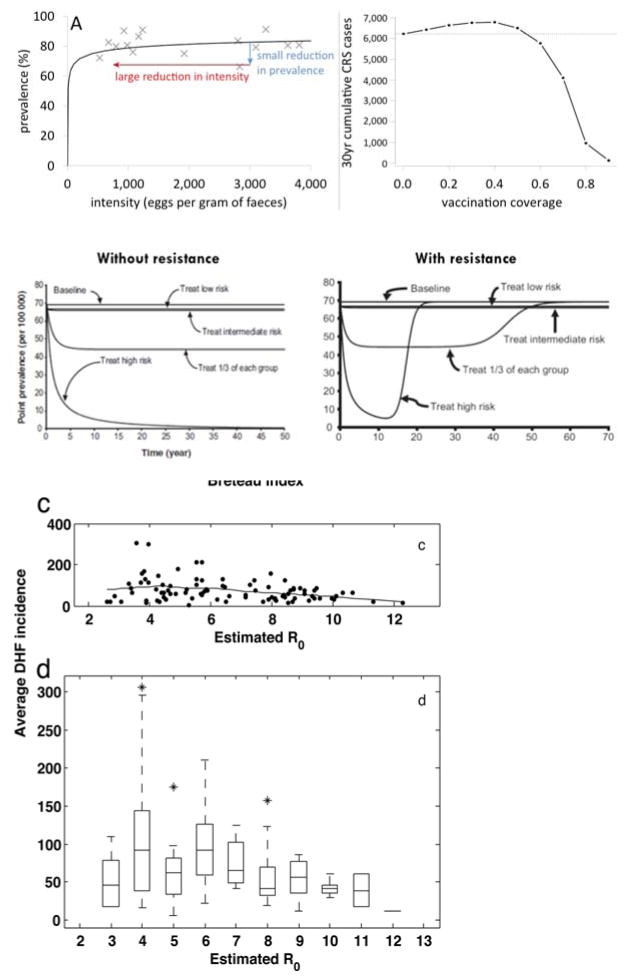
Despite some notable successes in the control of infectious diseases, transmissible pathogens still pose an enormous threat to human and animal health. The ecological and evolutionary dynamics of infections play out on a wide range of interconnected temporal, organizational, and spatial scales, which span hours to months, cells to ecosystems, and local to global spread. Moreover, some pathogens are directly transmitted between individuals of a single species, whereas others circulate among multiple hosts, need arthropod vectors, or can survive in environmental reservoirs. Many factors, including increasing antimicrobial resistance, increased human connectivity and changeable human behavior, elevate prevention and control from matters of national policy to international challenge. In the face of this complexity, mathematical models offer valuable tools for synthesizing information to understand epidemiological patterns, and for developing quantitative evidence for decision-making in global health.


Figures

Figure 1
Figure 1
Example of the process of modeling for public health, based on rubella. Policy questions are formulated; available data are brought to bear on the question, here illustrated by incidence of rubella following the introduction of vaccination in individuals aged less than 15 years, or 15 or more years in Costa Rica (127). Scientific understanding and subsequent policy advice is derived from model-based analyses of data, in this case using a non-linear age-structured SIR model (see Box 4), and can lead to collection of key missing data for model improvement. A plot illustrates insight where each square depicts a combination of birth rate and infant vaccine coverage (reflecting the situation in different countries, e.g. Somalia, diamond, Nepal, circle) for routine vaccination only. The color of the square indicates the confidence in the true value of R0 being higher (red) or lower (green) than a critical value that depends on birth rate and coverage. This translates into confidence that the public health burden caused by the rubella-complication of Congenital Rubella Syndrome (CRS) in newborns is likely to be reduced (green) compared to the situation without vaccination (128), suggesting that introduction of routine measles-rubella (MR) vaccine in Nepal is likely to succeed in bringing down CRS, while in Somalia routine MR vaccine would increase CRS burden without substantive improvements in the fraction that is vaccinated.
Figure 2
Figure 2
Examples of counter-intuitive effects of non-linear infection dynamics. Upper left graph: Non-linear interaction between prevalence of a helminth infection and infection pressure (as measured by the mean intensity of existing infections) means that control measures must have a disproportionately large impact on intensity before prevalence is reduced. This effect is predicted by a mathematical model (solid line) and corroborated by field data (crosses) (129). Upper right graph (adapted from 130): Non-linear relation between total number of cases of congenital rubella syndrome (CRS) and rubella vaccine coverage, showing that sub-optimal levels of vaccine coverage cause worse health outcomes than no vaccination. The line shows model predictions; similar effects have been documented for real rubella control situations (131). Middle graphs (from 132): Modeling results of rebound of gonorrhea transmission with different treatment strategies without (left panel) and with (right panel) antimicrobial resistance developing. In the presence of resistance, focusing treatment on the high-risk core group leads to an increase to un-treated baseline prevalence, after initially strong decline for more than a decade. Bottom graphs (from 133): Field data and box plot of a non-linear relation between R0 for dengue transmission and average dengue hemorrhagic fever incidence across Thailand, showing that starting control that brings down transmission from a situation with high R0 may paradoxically increase cases of DHF.

References

    1. World Health Organization. Global strategy for health for all by the year 2000. WHO; Geneva: 1981. http://whqlibdoc.who.int/publications/9241800038.pdf.
    1. World Health Organization. Mortality and global health estimates 2013. WHO; 2013. http://apps.who.int/gho/data/node.main.686?lang=en.
    1. Klepac P, Metcalf JE, Hampson K, editors. Towards the endgame and beyond: complexities and challenges for the elimination of infectious diseases. Phil Trans R Soc B. 2013;386(1623) - PMC - PubMed
    1. Daszak P, Cunningham AA, Hyatt AD. Emerging infectious diseases of wildlife--threats to biodiversity and human health. Science. 2000;287:443–449. - PubMed
    1. Jones KE, et al. Global trends in emerging infectious diseases. Nature. 2008;451:990–993. - PMC - PubMed

Publication types