

doi: 10.1038/srep09074.
Fly-scan ptychography
Affiliations
- PMID: 25766519
- PMCID: PMC4357920
- DOI: 10.1038/srep09074
Item in Clipboard
Fly-scan ptychography
Sci Rep.
.
Abstract
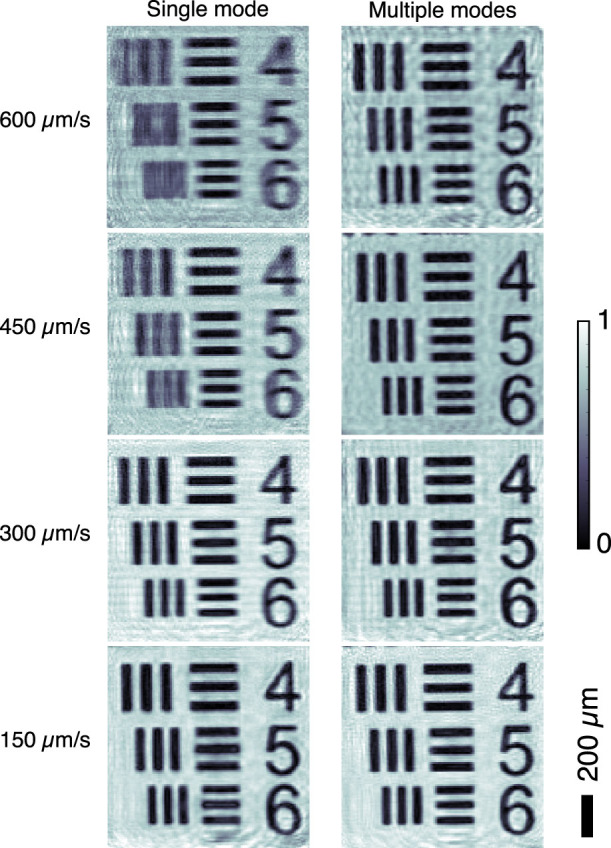
We report an experimental ptychography measurement performed in fly-scan mode. With a visible-light laser source, we demonstrate a 5-fold reduction of data acquisition time. By including multiple mutually incoherent modes into the incident illumination, high quality images were successfully reconstructed from blurry diffraction patterns. This approach significantly increases the throughput of ptychography, especially for three-dimensional applications and the visualization of dynamic systems.
Figures

The collimated 635 nm laser is focused on a pinhole to generate the incident illumination. A test pattern was placed and scanned at a plane about 9.8 mm downstream of the pinhole. The diffraction patterns were collected by a camera placed 31 mm further downstream.
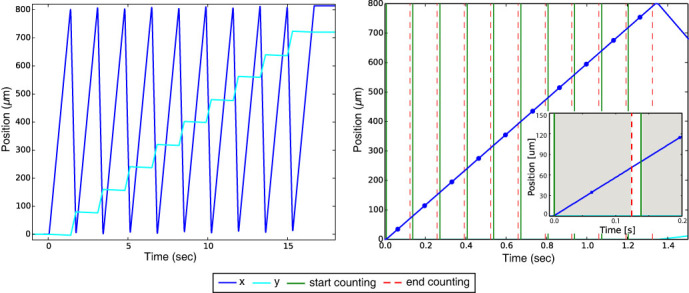
The motor movements along the fast (blue) and slow (cyan) scan axes are shown in the left panel. A zoomed-in view for the first scan line is displayed in the right panel. Each blue dot indicates the central location of a continuous motions during each data acquisition period. The solid green lines indicate the triggering time for the detector counting, and the dashed red lines indicate the completion time for data collection. The time interval from a solid green line to the next dashed red line defines the 0.12 second exposure time as indicated by the gray boxes in the inset, and the time interval from a dashed red line to the next solid green line is the 0.014 second dead time for detector readout.
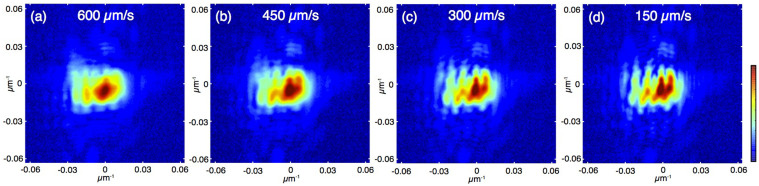
With a faster scan speed, a larger sample area is scanned over a single exposure period, resulting in a more blurry diffraction pattern.
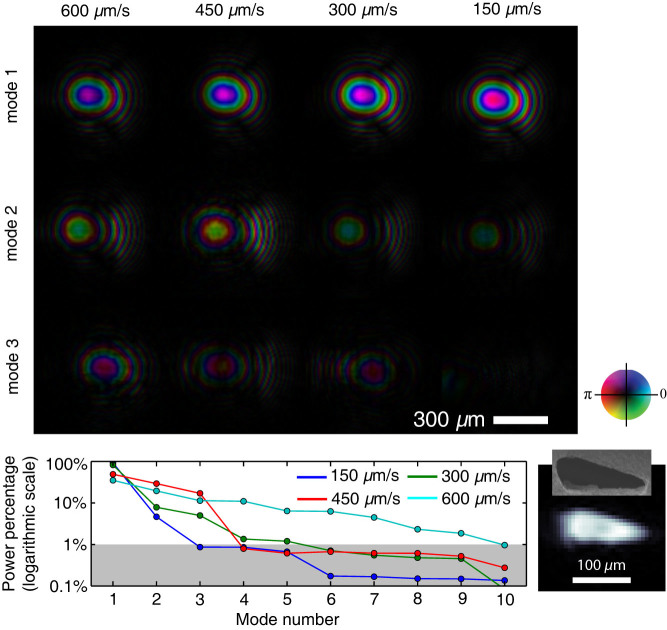
The bottom panel shows the power percentage of the recovered modes. With increased scan speed, more illumination power is removed from primary modes and redistributed into other modes. The inset in the bottom-left corner shows the propagation of the reconstructed illumination wave back to pinhole plane. The shape and dimension are consistent with SEM measurement of the pinhole.
References
-
- Hegerl R. & Hoppe W. Dynamic theory of crystalline structure analysis by electron diffraction in inhomogeneous primary wave field. Ber. Bunsenges. Phys. Chem. 74, 1148 (1970).
-
- Rodenburg J. & Bates R. The theory of super-resolution electron microscopy via wigner-distribution deconvolution. Phil. Trans. R. Soc. A. 339, 521–553 (1992).
-
- Nellist P., McCallum B. & Rodenburg J. Resolution beyond the ‘information limit’ in transmission electron microscopy. Nature 374, 630–632 (1995).
-
- Chapman H. Phase-retrieval x-ray microscopy by wigner-distribution deconvolution. Ultramicroscopy 66, 153–172 (1996).
-
- Chapman H. Phase-retrieval x-ray microscopy by wigner-distribution deconvolution: signal processing. Scanning Microscopy 11, 67–80 (1997).
Publication types
LinkOut - more resources
Full Text Sources
Other Literature Sources
