. 2015 Jun;41(6):1651-67.
doi: 10.1016/j.ultrasmedbio.2015.01.028. Epub 2015 Mar 9.

Effects of ultrasound frequency and tissue stiffness on the histotripsy intrinsic threshold for cavitation

Affiliations

Effects of ultrasound frequency and tissue stiffness on the histotripsy intrinsic threshold for cavitation

Eli Vlaisavljevich et al. Ultrasound Med Biol. 2015 Jun.

Abstract

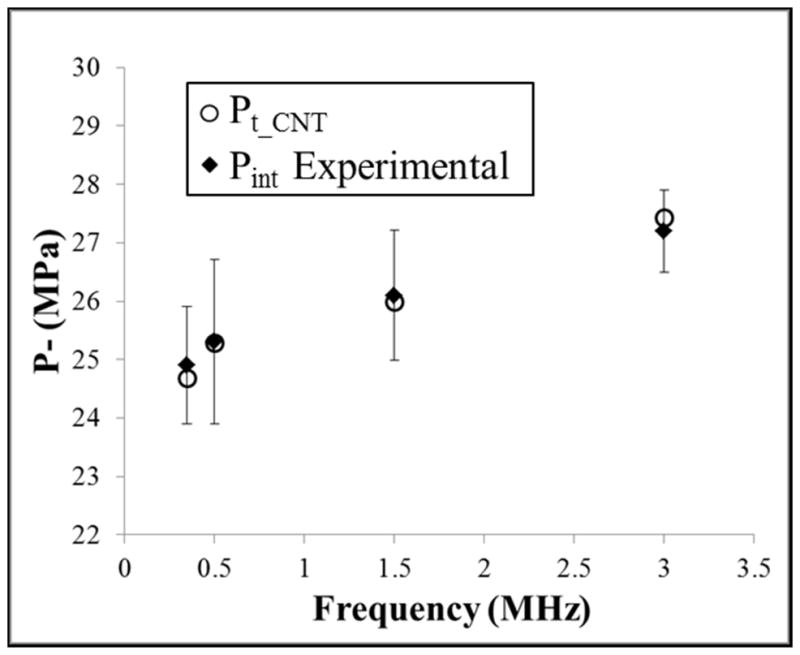
Histotripsy is an ultrasound ablation method that depends on the initiation of a cavitation bubble cloud to fractionate soft tissue. Previous work has indicated that a cavitation cloud can be formed by a single pulse with one high-amplitude negative cycle, when the negative pressure amplitude directly exceeds a pressure threshold intrinsic to the medium. We hypothesize that the intrinsic threshold in water-based tissues is determined by the properties of the water inside the tissue, and changes in tissue stiffness or ultrasound frequency will have a minimal impact on the histotripsy intrinsic threshold. To test this hypothesis, the histotripsy intrinsic threshold was investigated both experimentally and theoretically. The probability of cavitation was measured by subjecting tissue phantoms with adjustable mechanical properties and ex vivo tissues to a histotripsy pulse of 1-2 cycles produced by 345-kHz, 500-kHz, 1.5-MHz and 3-MHz histotripsy transducers. Cavitation was detected and characterized by passive cavitation detection and high-speed photography, from which the probability of cavitation was measured versus pressure amplitude. The results revealed that the intrinsic threshold (the negative pressure at which probability = 0.5) is independent of stiffness for Young's moduli (E) <1 MPa, with only a small increase (∼2-3 MPa) in the intrinsic threshold for tendon (E = 380 MPa). Additionally, results for all samples revealed only a small increase of ∼2-3 MPa when the frequency was increased from 345 kHz to 3 MHz. The intrinsic threshold was measured to be between 24.7 and 30.6 MPa for all samples and frequencies tested in this study. Overall, the results of this study indicate that the intrinsic threshold to initiate a histotripsy bubble cloud is not significantly affected by tissue stiffness or ultrasound frequency in the hundreds of kilohertz to megahertz range.

Keywords: Cavitation; Frequency; Histotripsy; Intrinsic threshold; Tissue mechanical properties.


Figures

Figure 1
Figure 1. Histotripsy waveforms
Plots showing example histotripsy waveforms produced by 345 kHz, 500 kHz, 1.5 MHz, and 3 MHz histotripsy transducers.
Figure 2
Figure 2. Experimental setup
Histotripsy pulses were applied to the inside of water, mechanically tunable tissue phantoms, and various ex vivo bovine tissues. Cavitation was monitored using high speed optical imaging for transparent samples. Additionally, cavitation was monitored using one of the therapy transducer elements as passive cavitation detection for all samples.
Figure 3
Figure 3. Cavitation Detection
Sample PCD temporal (left) and frequency (center) signals were used for cavitation detection. Results showed agreement with high speed optical images of cavitation (right). Representative images shown are from 1.5 MHz histotripsy pulses applied to degassed water (ultrasound propagating top to bottom).
Figure 4
Figure 4. Example of Integrated Power Spectrum (SPCD) Bimodal distribution
Results show the SPCD for 100 histotripsy pulses applied by the 1.5 MHz transducer at a peak negative pressure of 25.3 MPa. A bimodal distribution is evident, with the lower, more consistent values indicating the absence of cavitation, and the larger, more variable values indicating the presence of one or more bubbles.
Figure 5
Figure 5. Cavitation threshold in water
Example probability curves for water samples. Results showed a significant decrease the cavitation threshold for 90% O2 water at 345 kHz and 500 kHz compared to degassed 15% O2 water. No significant difference was observed between 90% O2 and 15% O2 water at 1.5 MHz or 3 MHz.
Figure 6
Figure 6. Cavitation threshold in tissue phantoms
Example probability curves for mechanically tunable agarose tissue phantoms. Results showed no significant difference in the intrinsic threshold with increasing stiffness. A small increase of ~2–3 MPa was observed in the threshold as the frequency was increased from 345 kHz to 3 MHz.
Figure 7
Figure 7. Cavitation detection in tissue phantoms
Example PCD signals (left) and corresponding optical images (right) of cavitation in agarose tissue phantoms of increasing Young’s moduli. The PCD signal was observed to remain sensitive to cavitation in stiffer phantoms despite the observe decrease in bubble size.
Figure 8
Figure 8. Cavitation threshold in ex vivo bovine tissue
Example probability curves for ex vivo bovine liver, tongue, and tendon. A small increase of ~2–3 MPa was observed in the threshold as the frequency was increased from 345 kHz to 3 MHz.
Figure 9
Figure 9. Intrinsic threshold comparison
(A) Bar plot shows the pint measured for all samples and frequencies studied in this work. The threshold for all samples remained between 24.7–30.6 MPa with the exception of 90% O2 water at 345 kHz and 500 kHz, which was signficantly lower. Results showed no trend in the intrinsic threshold with increasing stiffness for E<1 MPa, but a small increase of ~2–3 MPa was observed for tendon (E=380 MPa). (B) Linear regression analysis demonstrated that the change in pint with increasing Young’s modulus (tendon not included) was not significant via the Pearson correlation (r=–0.173, R2=0.030, p>0.05). (C) Linear regression analysis further showed that the ~2–3 MPa increase in pint with increasing frequency was significant via the Pearson correlation (r=0.57, R2=0.32, p<0.05).
Figure 10
Figure 10. Stabilized Nuclei Simulation
Simulated maximum bubble radius for a 2.5 nm initial bubble subjected to a single cycle histotripsy peak negative pressure waveform demonstrated a distinct threshold of ~28 MPa that was independent of (A) ultrasound frequency (E=1kPa) and (B) tissue stiffness for Young’s moduli <1 MPa (f=1.5MHz). (C) Simulations demonstrated that the cavitation threshold measured experimentally (24.7–30.6 MPa) corresponded to initial bubble sizes between 2.3–2.85 nm (E=1kPa, f=500kHz). (D) Increasing the initial bubble size from 1–100 nm resulted in a decrease in the cavitation threshold with a larger decrease observed at lower frequency (E=1kPa).
Figure 11
Figure 11. CNT Simulation
Classical nucleation theory was used to predict the effects of frequency on the cavitation threshold using equation E7. Results demonstrated an increase in pt_CNT of 2.7 MPa as the frequency was increased from 345 kHz to 3 MHz (o). Comparisons to the average experimental results for pint in agarose tissue phantoms (◆) demonstrate close agreement between theory and experiments.

References

    1. Arvengas A, Davitt K, Caupin F. Fiber optic probe hydrophone for the study of acoustic cavitation in water. Rev Sci Instrum. 2011a;82:034904. - PubMed
    1. Arvengas A, Herbert E, Cersoy S, Davitt K, Caupin F. Cavitation in heavy water and other liquids. J Phys Chem B. 2011b;115:14240–5. - PubMed
    1. Balgude AP, Yu X, Szymanski A, Bellamkonda RV. Agarose gel stiffness determines rate of DRG neurite extension in 3D cultures. Biomaterials. 2001;22:1077–84. - PubMed
    1. Blake FG. Gas Bubbles as Cavitation Nuclei. Physical Review. 1949;75:1313.
    1. Briggs LJ. The Limiting Negative Pressure of Water between 0-Degrees-C and 50-Degrees-C. Science. 1950;111:461.

Publication types