. 2015 Feb 27;16(1):138.
doi: 10.1186/s12864-015-1292-z.

Enrichment of inflammatory bowel disease and colorectal cancer risk variants in colon expression quantitative trait loci

Affiliations

Enrichment of inflammatory bowel disease and colorectal cancer risk variants in colon expression quantitative trait loci

Imge Hulur et al. BMC Genomics. .

Abstract

Background: Genome-wide association studies (GWAS) have identified single nucleotide polymorphisms (SNPs) associated with diseases of the colon including inflammatory bowel diseases (IBD) and colorectal cancer (CRC). However, the functional role of many of these SNPs is largely unknown and tissue-specific resources are lacking. Expression quantitative trait loci (eQTL) mapping identifies target genes of disease-associated SNPs. This study provides a comprehensive eQTL map of distal colonic samples obtained from 40 healthy African Americans and demonstrates their relevance for GWAS of colonic diseases.

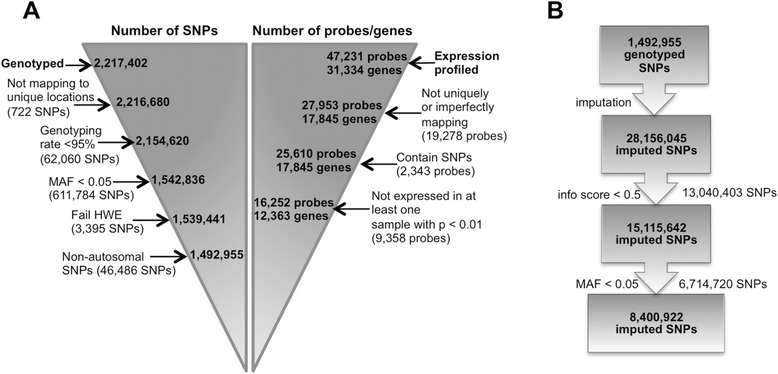
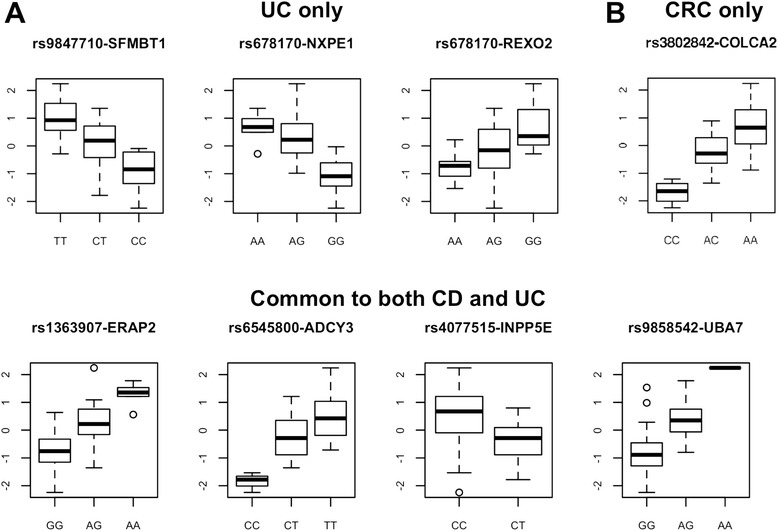
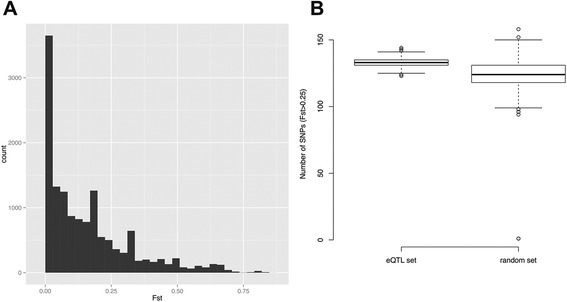
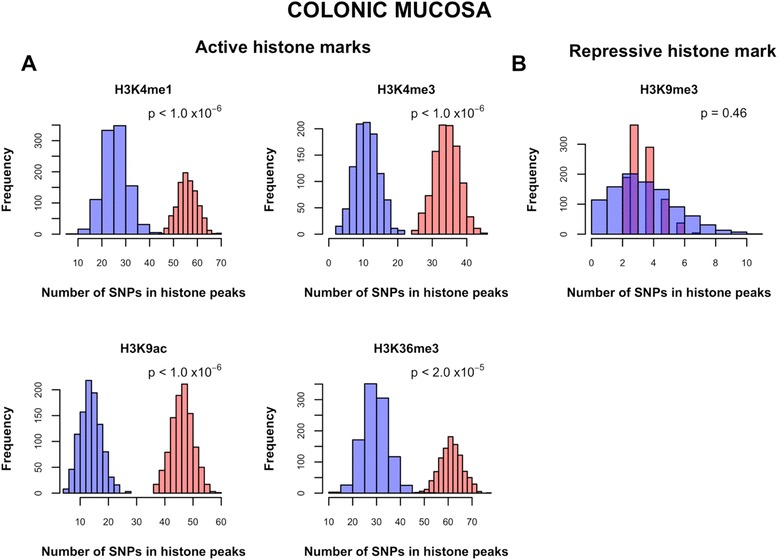
Results: 8.4 million imputed SNPs were tested for their associations with 16,252 expression probes representing 12,363 unique genes. 1,941 significant cis-eQTL, corresponding to 122 independent signals, were identified at a false discovery rate (FDR) of 0.01. Overall, among colon cis-eQTL, there was significant enrichment for GWAS variants for IBD (Crohn's disease [CD] and ulcerative colitis [UC]) and CRC as well as type 2 diabetes and body mass index. ERAP2, ADCY3, INPP5E, UBA7, SFMBT1, NXPE1 and REXO2 were identified as target genes for IBD-associated variants. The CRC-associated eQTL rs3802842 was associated with the expression of C11orf93 (COLCA2). Enrichment of colon eQTL near transcription start sites and for active histone marks was demonstrated, and eQTL with high population differentiation were identified.

Conclusions: Through the comprehensive study of eQTL in the human colon, this study identified novel target genes for IBD- and CRC-associated genetic variants. Moreover, bioinformatic characterization of colon eQTL provides a tissue-specific tool to improve understanding of biological differences in diseases between different ethnic groups.


Figures

Figure 1
Figure 1
Flowchart summarizing the study design. (A) Flowchart describing the quality control (QC) process for the SNP genotype and gene expression data (See Methods for details). The numbers inside the triangles correspond to the numbers of SNPs or probes/genes that are left after the removal of those (numbers given inside parentheses) that fail to meet the QC criteria outlined in the text next to the arrows. 1,492,955 genotyped SNPs passed the QC filters and were imputed. 16,252 gene expression probes corresponding to 12,363 unique genes passed the QC filters and were included in the eQTL analysis. (B) Flowchart summarizing the imputation and post-imputation QC steps for the 1,492,955 genotyped SNPs that passed QC in (A) and were imputed using 1000 Genomes as reference to provide data on 28,156,045 SNPs (see Methods for details). The description of each step along with the numbers of SNPs that were excluded at each is listed next to the arrows. The final dataset consisted of 8,400,922 imputed SNPs in 48 individuals.
Figure 2
Figure 2
Colon cis- eQTL that are also associated with colonic diseases. The box plots depict the relationship between SNPs associated with (A) IBD (i.e. CD and/or UC) or (B) CRC from the NHGRI GWAS catalog and their target gene’s expression. The x-axes correspond to the SNP genotypes, and the y-axes represent the log2-normalized gene expression values. The median gene expression level for each genotype is indicated by a horizontal line with the boxes covering 25th and 75th percentiles and the whiskers extending to 1.5 times the interquartile range. Points outside the whiskers are plotted as outliers. For each target gene, the disease-associated SNP was selected for the box plot even if it is not the most significant cis-eQTL (but must be in r2 ≥ 0.8 with it).
Figure 3
Figure 3
Cis- eQTL are enriched for SNPs that are highly differentiated between European and African populations. FST values for the study SNPs were calculated between 1000 Genomes Project European (EUR) and African (AFR) populations using Weir and Cockerham’s unbiased estimator. SNPs with FST > 0.25 were defined as population differentiated SNPs. (A) The histogram shows the distribution of FST values for the significant colon cis-eQTL (FDR < 0.20). Among the 14,135 cis-eQTL for which FST estimates were obtained, 3,185 (23%) were population differentiated. (B) Enrichment of population differentiated SNPs among significant colon cis-eQTL was evaluated using a simulation-based method. The box plot depicts the distributions of the number of population differentiated SNPs among 1,000 randomly selected cis-eQTL SNP sets (left)―generated by randomly selecting a single SNP for each unique cis-eQTL target gene (n = 684) among all cis-eQTL (FDR < 0.20) that are significantly associated with the expression of that gene―and among 1000 random sets of SNPs (right), each matching the set of 684 significant cis-eQTL SNPs, based on the distributions of MAF and distance from the nearest TSS. The numbers of population differentiated SNPs among the eQTL and random SNP sets are indicated by horizontal lines with the boxes covering 25th and 75th percentiles and the whiskers extending to 1.5 times the interquartile range. The numbers of population differentiated SNPs in the eQTL sets were significantly higher than in the random sets of SNPs (p < 0.001 by Mann–Whitney test).
Figure 4
Figure 4
SNPs associated with colonic diseases and type 2 diabetes are enriched for colon cis -eQTL. A simulation-based analysis was performed to test for the enrichment of colon cis-eQTL among SNPs associated with colonic diseases (A) body mass index (BMI), lipid traits and type 2 diabetes (T2D) (B) downloaded from the NHGRI GWAS catalog. The distribution of the number of cis-eQTL in 1,000 simulated SNP sets, each of the same size (n) as the list of trait-associated SNPs and containing SNPs matched on MAF distribution is shown in the histograms. Solid black circles represent the actual cis-eQTL count (cis-eQTL p-value threshold of 0.001) observed in the trait-associated SNPs. The p-values shown are empirical, and are calculated as the proportion of sampled SNP sets in which the cis-eQTL count exceeds the actual count observed in the trait-associated SNPs. Enrichment of cis-eQTL among disease-associated SNPs is statistically significant for all colonic diseases. Enrichment of cis-eQTL is statistically significant for T2D (p = 0.034) and suggestively significant for BMI (p = 0.055). There is no enrichment of cis-eQTL among SNPs associated with lipid traits.
Figure 5
Figure 5
Cis -eQTL are enriched for active but not repressive histone marks in colonic mucosa. The red histogram in each plot depicts the distribution of the number of SNPs in histone mark peaks in 1,000 randomly selected cis-eQTL SNP sets, which are generated by randomly selecting a single SNP for each unique cis-eQTL target gene (n = 684) among all cis-eQTL (FDR < 0.10) that are significantly associated with the expression of that gene. The blue histograms represent the distributions of the number of SNPs in histone mark peaks in 1,000 randomly sampled SNP sets, each matching the set of 684 significant cis-eQTL SNPs (chosen at random from the set of 1,000 cis-eQTL SNPs depicted in red) with respect to MAF and distance from the nearest TSS. Four markers of active chromatin (H3K4me1, H3K4me3, H3K9ac and H3K36me3) are depicted in (A), while a single marker of inactive chromatin (H3K9me3) is depicted in (B). The p-value in the top right corner of each histogram is the empirical p-value obtained by comparing the number of SNPs in histone mark peaks in the 1,000 sets of cis-eQTL SNPs (red) to the null distribution given by the 1,000 sets of matched SNPs (blue).

References

    1. Anderson CA, Boucher G, Lees CW, Franke A, D’Amato M, Taylor KD, et al. Meta-analysis identifies 29 additional ulcerative colitis risk loci, increasing the number of confirmed associations to 47. Nat Genet. 2011;43(3):246–52. doi: 10.1038/ng.764. - DOI - PMC - PubMed
    1. Franke A, Balschun T, Sina C, Ellinghaus D, Hasler R, Mayr G, et al. Genome-wide association study for ulcerative colitis identifies risk loci at 7q22 and 22q13 (IL17REL) Nat Genet. 2010;42(4):292–4. doi: 10.1038/ng.553. - DOI - PubMed
    1. Franke A, Balschun T, Karlsen TH, Hedderich J, May S, Lu T, et al. Replication of signals from recent studies of Crohn’s disease identifies previously unknown disease loci for ulcerative colitis. Nat Genet. 2008;40(6):713–5. doi: 10.1038/ng.148. - DOI - PubMed
    1. McGovern DP, Gardet A, Torkvist L, Goyette P, Essers J, Taylor KD, et al. Genome-wide association identifies multiple ulcerative colitis susceptibility loci. Nat Genet. 2010;42(4):332–7. doi: 10.1038/ng.549. - DOI - PMC - PubMed
    1. Barrett JC, Lee JC, Lees CW, Prescott NJ, Anderson CA, Phillips A, et al. Genome-wide association study of ulcerative colitis identifies three new susceptibility loci, including the HNF4A region. Nat Genet. 2009;41(12):1330–4. doi: 10.1038/ng.483. - DOI - PMC - PubMed

Publication types