Mandibular movements identify respiratory effort in pediatric obstructive sleep apnea
- PMID: 25766710
- PMCID: PMC4410931
- DOI: 10.5664/jcsm.4706
Mandibular movements identify respiratory effort in pediatric obstructive sleep apnea
Abstract
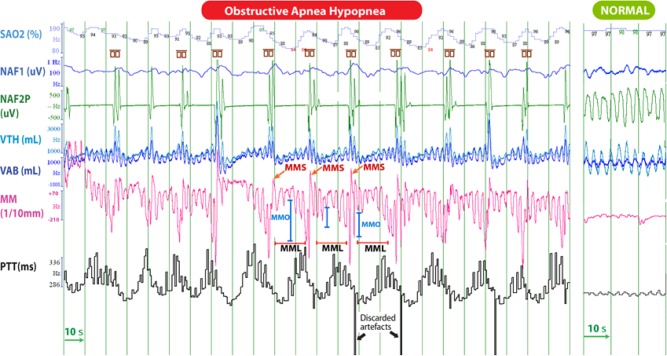
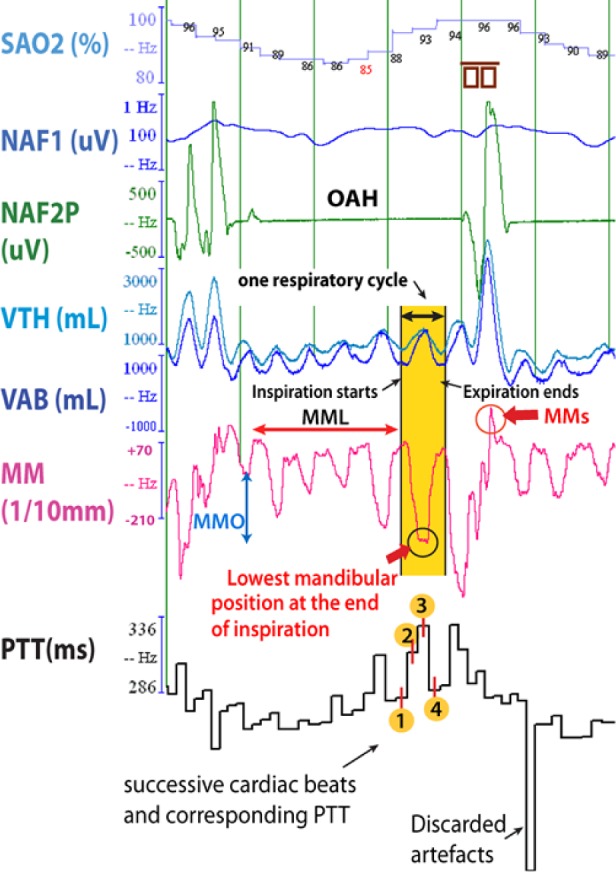
Study objectives: Obstructive sleep apnea-hypopnea (OAH) diagnosis in children is based on the quantification of flow and respiratory effort (RE). Pulse transit time (PTT) is one validated tool to recognize RE. Pattern analysis of mandibular movements (MM) might be an alternative method to detect RE. We compared several patterns of MM to concomittant changes in PTT during OAH in children with adenotonsillar hypertrophy.
Participants: 33 consecutive children with snoring and symptoms/signs of OAH.
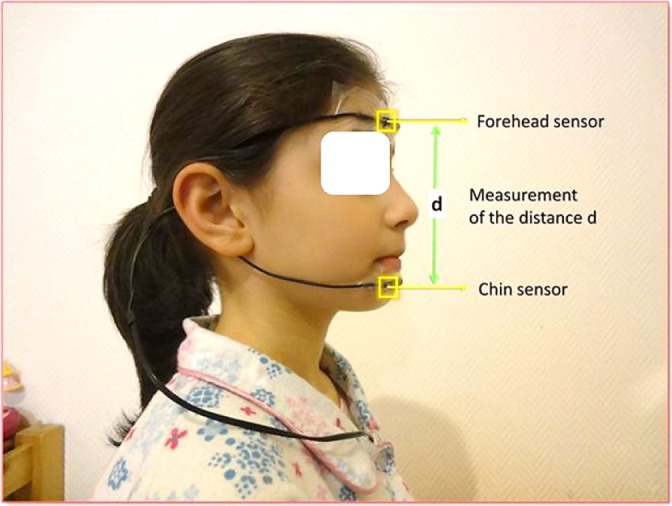
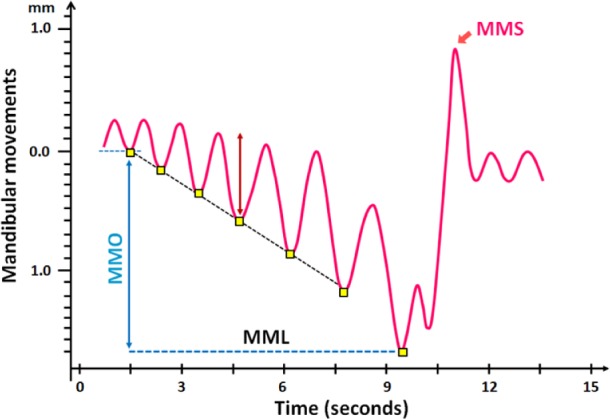
Measurements: MMs were measured during polysomnography with a magnetometer device (Brizzy Nomics, Liege, Belgium) placed on the chin and forehead. Patterns of MM were evaluated representing peak to peak fluctuations > 0.3 mm in mandibular excursion (MML), mandibular opening (MMO), and sharp MM (MMS), which closed the mouth on cortical arousal (CAr).
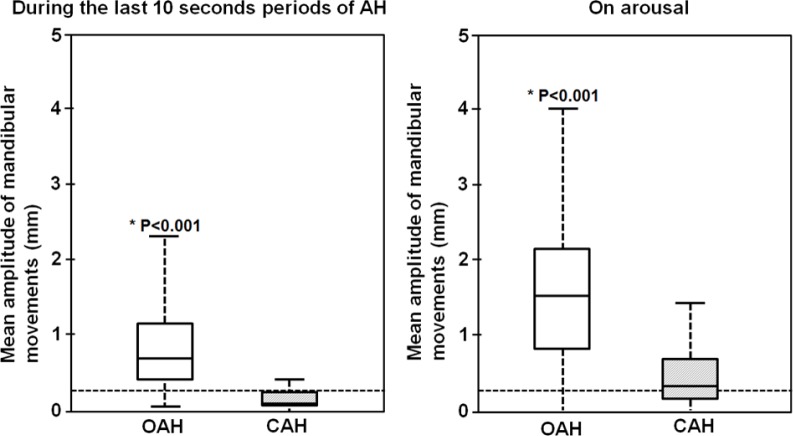
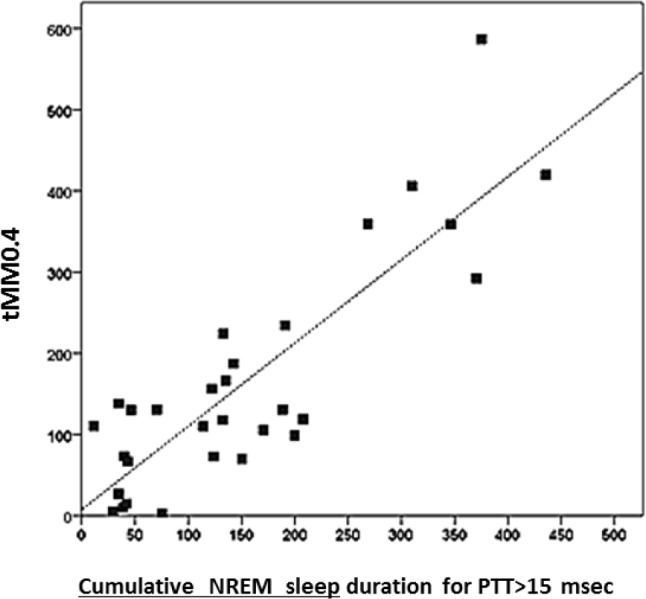
Results: The median (95% CI) hourly rate of at least 1 MM (MML, or MMO, or MMS) was 18.1 (13.2-36.3) and strongly correlated with OAHI (p = 0.003) but not with central apnea-hypopnea index (CAHI; p = 0.292). The durations when the MM amplitude was > 0.4 mm and PTT > 15 ms were strongly correlated (p < 0.001). The mean (SD) of MM peak to peak amplitude was larger during OAH than CAH (0.9 ± 0.7 mm and 0.2 ± 0.3 mm; p < 0.001, respectively). MMS at the termination of OAH had larger amplitude compared to MMS with CAH (1.5 ± 0.9 mm and 0.5 ± 0.7 mm, respectively, p < 0.001).
Conclusions: MM > 0.4 mm occurred frequently during periods of OAH and were frequently terminated by MMS corresponding to mouth closure on CAr. The MM findings strongly correlated with changes in PTT. MM analysis could be a simple and accurate promising tool for RE characterization and optimization of OAH diagnosis in children.
Keywords: mandibular movements; pediatric obstructive sleep apnea; pulse transit time; respiratory effort.
© 2015 American Academy of Sleep Medicine.
Figures
References
-
- Guilleminault C, Pelayo R. Sleep-disordered breathing in children. Ann Med. 1998;30:350–6. - PubMed
-
- Guilleminault C, Pelayo R, Leger D, Clerk A, Bocian RC. Recognition of sleep-disordered breathing in children. Pediatrics. 1996;98:871–82. - PubMed
-
- Halbower AC, Ishman SL, McGinley BM. Childhood obstructive sleep-disordered breathing: a clinical update and discussion of technological innovations and challenges. Chest. 2007;132:2030–41. - PubMed
-
- Gleeson K, Zwillich CW, White DP. The influence of increasing ventilatory effort on arousal from sleep. Am Rev Respir Dis. 1990;142:295–300. - PubMed
-
- Pépin JL, Delavie N, Pin I, et al. Pulse transit time improves detection of sleep respiratory events and microarousals in children. Chest. 2005;127:722–30. - PubMed
MeSH terms
LinkOut - more resources
Full Text Sources
Other Literature Sources
Medical