. 2015 Mar 2:10:1649-66.
doi: 10.2147/IJN.S67113. eCollection 2015.

Antileukemic effect of zerumbone-loaded nanostructured lipid carrier in WEHI-3B cell-induced murine leukemia model

Affiliations

Antileukemic effect of zerumbone-loaded nanostructured lipid carrier in WEHI-3B cell-induced murine leukemia model

Heshu Sulaiman Rahman et al. Int J Nanomedicine. .

Retraction in

Abstract

Cancer nanotherapy is progressing rapidly with the introduction of many innovative drug delivery systems to replace conventional therapy. Although the antitumor activity of zerumbone (ZER) has been reported, there has been no information available on the effect of ZER-loaded nanostructured lipid carrier (NLC) (ZER-NLC) on murine leukemia cells. In this study, the in vitro and in vivo effects of ZER-NLC on murine leukemia induced with WEHI-3B cells were investigated. The results from 3-[4,5-dimethylthiazol-2-yl]-2,5-diphenyltetrazolium bromide, Hoechst 33342, Annexin V, cell cycle, and caspase activity assays showed that the growth of leukemia cells in vitro was inhibited by ZER-NLC. In addition, outcomes of histopathology, transmission electron microscopy, and Tdt-mediated dUTP nick-end labeling analyses revealed that the number of leukemia cells in the spleen of BALB/c leukemia mice significantly decreased after 4 weeks of oral treatment with various doses of ZER-NLC. Western blotting and reverse-transcription quantitative polymerase chain reaction assays confirmed the antileukemia effects of ZER-NLC. In conclusion, ZER-NLC was shown to induce a mitochondrial-dependent apoptotic pathway in murine leukemia. Loading of ZER in NLC did not compromise the anticancer effect of the compound, suggesting ZER-NLC as a promising and effective delivery system for treatment of cancers.

Keywords: BALB/c mice; WEHI-3B cells; apoptosis; leukemia; mitochondrial pathway; zerumbone-loaded nanostructured lipid carrier.


Figures

Figure 1
Figure 1
Cytotoxic effect of ZER-NLC (A) and doxorubicin (B) on WEHI-3B cells assessed by MTT assay. Note: Each point is the mean value of three replicates. Abbreviations: ZER-NLC, zerumbone-loaded nanostructured lipid carrier; MTT, 3-[4,5-dimethylthiazol-2-yl]-2,5-diphenyltetrazolium bromide; h, hours.
Figure 2
Figure 2
Fluorescent photomicrographs of WEHI-3B cells stained with Hoechst 33342 and treated with zerumbone nanostructured lipid carrier. Notes: (A) Control. (B) Chromatin condensation, membrane blebbing, and margination of the nucleus (24 hours). (C) Blebbing of cell membrane, chromatin condensation, marginated nucleus, and apoptotic body formation (48 hours). (D) Cell membrane blebbing, chromatin condensation, apoptosis body formation, cell shrinkage (×400 magnification), and death (72 hours). Abbreviations: BL, Blebbing; CC, chromatin condensation; MN, mariginated nucleus; AB, apoptotic body; CS, cell shrinkage.
Figure 3
Figure 3
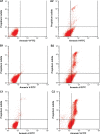
Flow cytometric analysis of WEHI-3B cells treated with ZER-NLC and after staining with FITC-conjugated Annexin-V and PI. Notes: A1C1: Untreated Jurkat cell control at 12 hours, 24 hours, and 48 hours, respectively. A2C2: WEHI-3B cells treated with ZER-NLC for 12 hours, 24 hours, and 48 hours, respectively. Abbreviations: ZER-NLC, zerumbone-loaded nanostructured lipid carrier; FITC, fluorescein isothiocyanate; PI, propidium iodide.
Figure 4
Figure 4
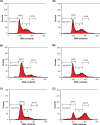
Cell cycle analysis of WEHI cells treated with zerumbone nanostructured lipid carrier. Notes: The DNA contents were analyzed by flow cytometry. A1C1: Untreated WEHI-3B cell control at 24 hours, 48 hours, and 72 hours, respectively. A2C2: WEHI-3B cells treated with zerumbone nanostructured lipid carrier for 24 hours, 48 hours, and 72 hours, respectively. G0/G1, G2/M, and S are cell phases, and sub-G1 DNA content refers to apoptotic cells.
Figure 5
Figure 5
Effect of ZER-NLC on caspase-3 and -9 activities in the WEHI-3B cells after 24 hours, 48 hours, and 72 hours of treatment. Notes: Results are expressed as the optical density (400 nm) ± SD of three independent experiments. *Indicates a significant difference (P<0.05). Abbreviations: ZER-NLC, zerumbone-loaded nanostructured lipid carrier; h, hours; SD, standard deviation.
Figure 6
Figure 6
Peripheral blood myeloid (red arrow) and monocytic (black arrow) cells in leukemic BALB/c mice (×1000 magnification).
Figure 7
Figure 7
Spleen of BALB/c mice (H&E). Notes: (A) Untreated control representing normal cells. (B) Leukemia control representing massive neoplastic cells. (C) Nanostructured lipid-carrier-treated group representing distinctive neoplastic cells. (D) Low-dose zerumbone nanostructured lipid-carrier-treated group demonstrating the reduction in the number of leukemic cells. (E) High-dose zerumbone nanostructured lipid-carrier-treated and (F) ATRA-treated groups representing high reduction in leukemic cells in comparison to leukemia control. Normal cells are represented by white arrows and leukemic cells by black arrows (×1000 magnification). Abbreviations: ATRA, all trans-retinoic acid; H&E, hematoxylin and eosin.
Figure 8
Figure 8
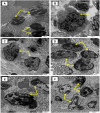
Ultrastructure of spleen tissue of BALB/c mice. Notes: (A) Normal cell of untreated control group. (B) Giant leukemic cell in untreated leukemic mice. (C) Nanostructure lipid-carrier-treated group showing neoplastic cell. (D) Low-dose zerumbone-loaded nanostructure lipid-carrier-treated spleen showing blebbing, condensation, and margination of nucleus. (E) High-dose zerumbone-loaded nanostructure lipid-carrier-treated spleen showing blebbing, nuclear fragmentation, and chromatin condensation. (F) ATRA-treated spleen showing nuclear fragmentation and chromatin condensation. Abbreviation: ATRA, all trans-retinoic acid.
Figure 9
Figure 9
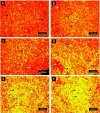
Spleen tissue of BALB/c mice analyzed by TUNEL assay. Notes: (A) Untreated normal control. (B) Leukemic group. Both groups show non-apoptotic cells. (C) Nanostructured lipid carrier-treated spleen showing nonsignificant (P>0.05) apoptosis. (D) Low-dose zerumbone-loaded nanostructured-lipid-carrier treated spleen showing significant apoptosis (P<0.05). (E) High-dose zerumbone-loaded nanostructured lipid-carrier-treated spleen showing significant apoptosis (P<0.05), (F) ATRA-treated spleen tissue. Both treatments caused significant (P<0.05) increase in number of apoptotic cells. Non-apoptotic cells: orange colored (white arrows); apoptotic cells: fluorescent colored (black arrows) (×400 magnification). Abbreviations: TUNEL, Tdt-mediated dUTP nick-end labeling; ATRA, all trans-retinoic acid.
Figure 10
Figure 10
Protein expression in spleen tissue of leukemic BALB/c mice observed by western blotting assay. Notes: (A) Untreated control. (B) Leukemia control. (C) Nanostructured lipid-carrier-treated (NLC) tissue. (D) Low-dose zerumbone-loaded nanostructured lipid carrier treated tissue. (E) High-dose zerumbone-loaded nanostructured lipid carrier treated tissue. (F) ATRA-treated tissue. Abbreviation: ATRA, all trans-retinoic acid.
Figure 11
Figure 11
Protein expression analysis in BALB/c mice spleen tissues by western blotting assay using Image J software. Notes: Data have been analyzed using post hoc comparison test/one-way ANOVA, means compare by Tukey’s b-test. Data revealed significant (P<0.05) expression of Bax, Cyt-c, and PARP proteins in treated (ZER-NLC and ATRA) groups compared to the untreated leukemia control group. However, significant suppression (P<0.05) of Bcl-2 protein was found in treated (ZER-NLC and ATRA) groups compared to untreated leukemic group. Nonsignificant expression (P>0.05) of FasL protein was found in ZER-NLC- and ATRA-treated groups. Abbreviations: ZER-NLC, zerumbone-loaded nanostructured lipid carrier; ATRA, all trans-retinoic acid; ANOVA, analysis of variance.
Figure 12
Figure 12
The amplification plot of β-actin (A), GAPDH (B), Bcl-2 (C), Bax (D), Cyt-c (E), PARP (F), and FasL (G) genes. Notes: qPCR analysis was performed on leukemic BALB/c spleen tissue treated with different doses of ZER-NLC and ATRA using CFX Manager™ software (version 1.6; BioRad, Hercules, CA, USA). Abbreviations: ZER-NLC, zerumbone-loaded nanostructured lipid carrier; ATRA, all trans-retinoic acid; qPCR, quantitative polymerase chain reaction; RFU, relative fluorescence unit.
Figure 13
Figure 13
mRNA expression quantity levels of Bcl-2, Bax, Cyt-c, PARP, and FasL normalized to the transcription levels of β-actin and GAPDH. qPCR analysis was performed on leukemic BALB/c spleen tissue treated with different doses of ZER-NLC and ATRA. Values are expressed as mean ± SD. Data were analyzed using post hoc comparison test one-way ANOVA, and means compared by Tukey’s b-test. Abbreviations: ZER-NLC, zerumbone-loaded nanostructured lipid carrier; ATRA, all trans-retinoic acid; qPCR, quantitative polymerase chain reaction; ANOVA, analysis of variance; SD, standard deviation.

References

    1. Alitheen NB, Yeap SK, Faujan NH, Ho WY, Beh BK, Mashitoh AR. Leukemia and therapy. Am J Immunol. 2012;7:54–61.
    1. Jemal A, Siegel R, Xu J, Ward E. Cancer statistics, 2010. CA Cancer J Clin. 2010;60:277–300. - PubMed
    1. CFF . Cancer Facts & Figures 2012. Atlanta, GA: American Cancer Society; 2012.
    1. Bharali DJ, Siddiqui IA, Adhami VM, et al. Nanoparticle delivery of natural products in the prevention and treatment of cancers: current status and future prospects. Cancers. 2011;3:4024–4045. - PMC - PubMed
    1. Pan MH, Ho CT. Chemopreventive effects of natural dietary compounds on cancer development. Chem Soci Rev. 2008;37:2558–2574. - PubMed

Publication types