. 2015 Mar 4:11:14.
doi: 10.1186/s13007-015-0056-8. eCollection 2015.

Plant phenotyping: from bean weighing to image analysis

Affiliations

Plant phenotyping: from bean weighing to image analysis

Achim Walter et al. Plant Methods. .

Abstract

Plant phenotyping refers to a quantitative description of the plant's anatomical, ontogenetical, physiological and biochemical properties. Today, rapid developments are taking place in the field of non-destructive, image-analysis -based phenotyping that allow for a characterization of plant traits in high-throughput. During the last decade, 'the field of image-based phenotyping has broadened its focus from the initial characterization of single-plant traits in controlled conditions towards 'real-life' applications of robust field techniques in plant plots and canopies. An important component of successful phenotyping approaches is the holistic characterization of plant performance that can be achieved with several methodologies, ranging from multispectral image analyses via thermographical analyses to growth measurements, also taking root phenotypes into account.


Figures
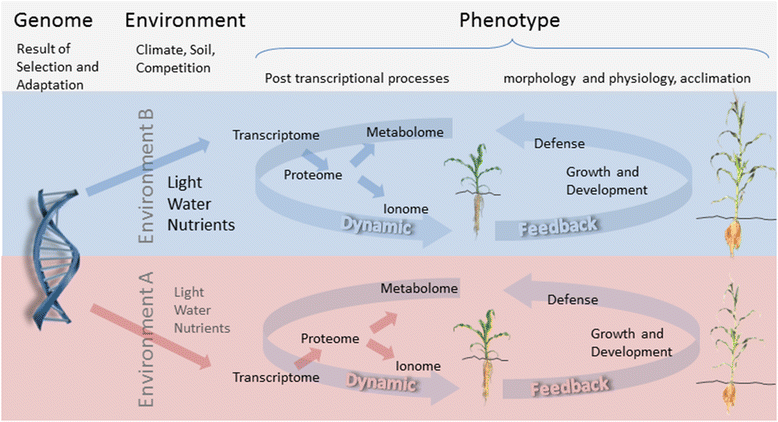
Figure 1
Figure 1
Relation between genotype and phenotype. The phenotype is characterized by an enormous amount of processes, functions and structures which are changing during growth and development. Moreover, the regulation of these processes is affected via multiple, dynamic feedback loops by the ever-changing environment. For example: the genotypes available to farmers in form of modern cultivars are the result of selection (by nature and breeders) including biotechnological improvements. While the genotype is comparable to the letters in a book, the interpretation of the genotypic information is affected by the environment. Different genotypes may respond differently to environmental triggers such as limited resources of environment A vs. B. This genotype-by-environment interaction results in different phenotypes which are observable at various organizational levels. A phenotype involves a cascade of processes sequentially altering the composition of the transcribed genes (transcriptome) and their resulting proteins (proteome). These in turn affect the metabolites and ions and act on the development of the plant leading to observable differences in crop physiology and morphology.
Figure 2
Figure 2
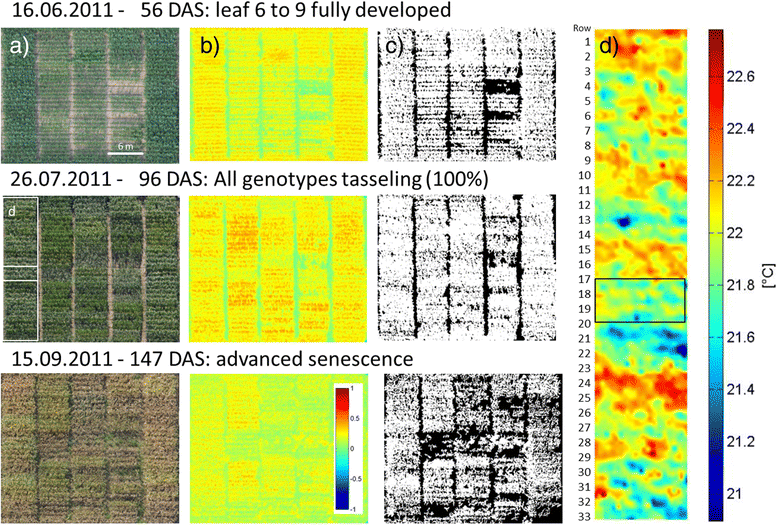
Images related to core methods of image-based plant phenotyping in the field at three characteristic ontogenetic stages typically investigated for breeding purposes in maize. Images are taken from a maize field experiment in Germany [24] at several ontogenetic stages from an altitude of 300 m. a) RGB image, b) NDVI-image, c) canopy cover segmented from NDVI-image, d) thermography image of a subsection of the area shown in the image from 26.07.2011. The graph shows a set of maize genotypes at an early growth stage when canopy cover is different (16.06.2011), at a growth stage when the canopy of all genotypes is closed but leaf greenness and tassel appearance differs between genotypes (26.07.2011) and at a late, senescent stage when different levels of senescence or stay green can be observed (15.09.2011).
Figure 3
Figure 3
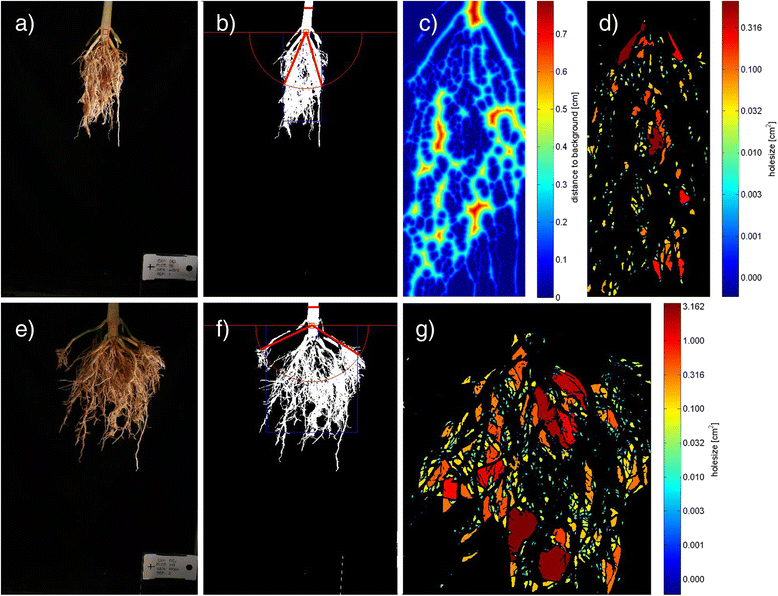
Example images related to shovelomics, a method for field phenotyping of crop root systems: Two field grown maize genotypes (top, bottom) with contrasting root angles, identified with the software REST (Root Estimator for Shovelomics Traits) [119]. Original image (a, e), resulting area of interest containing about 90% of the root system (g, f; blue box) and the opening angle of the root system (b, f; red lines); visualized thickness of root clusters (c); and whole sizes (d, g), related to root branching.

References

    1. Johannsen W. Erblichkeit in Populationen und reinen Linien. Jena: Gustav Fischer Verlag; 1903.
    1. Johannsen W. The genotype conception of heredity. Am Nat. 1911;45:129–59. - PMC - PubMed
    1. Schulze WX, Usadel B. Quantitation in Mass-Spectrometry-Based Proteomics. Annu Rev Plant Biol. 2010;61:491–516. - PubMed
    1. Schauer N, Fernie AR. Plant metabolomics: towards biological function and mechanism. Trends Plant Sci. 2006;11:508–16. - PubMed
    1. Houle D, Govindaraju DR, Omholt S. Phenomics: the next challenge. Nat Rev Genet. 2010;11:855–66. - PubMed