. 2015 Mar 13;10(3):e0118697.
doi: 10.1371/journal.pone.0118697. eCollection 2015.

Uncovering the nutritional landscape of food

Affiliations

Uncovering the nutritional landscape of food

Seunghyeon Kim et al. PLoS One. .

Erratum in

Abstract

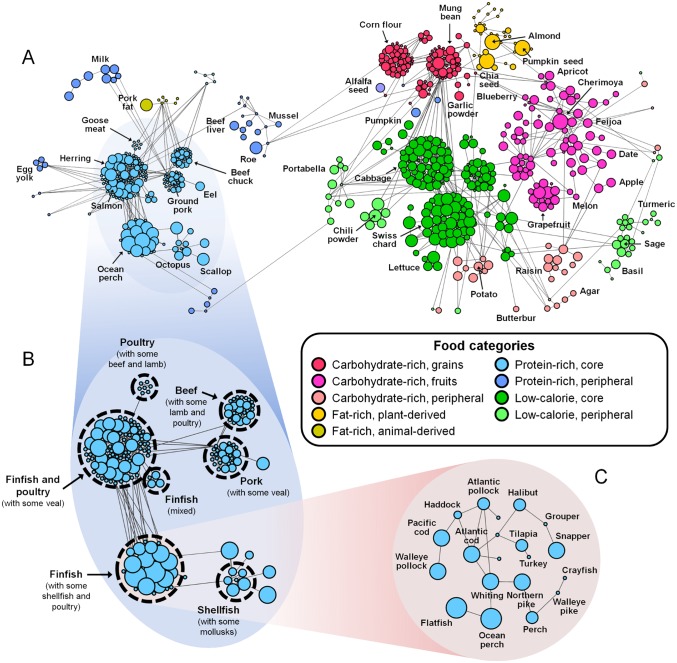
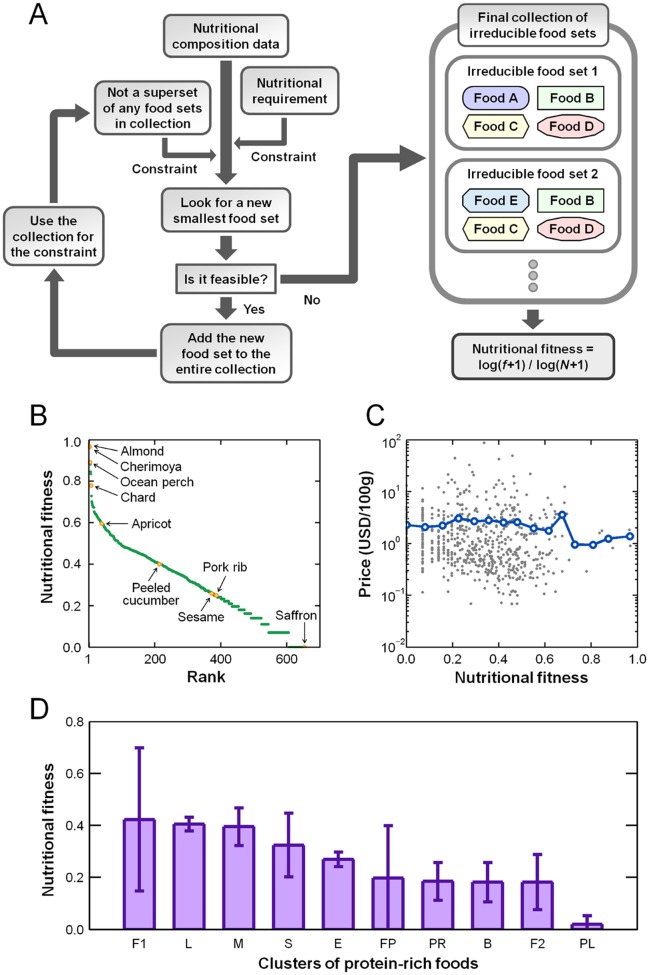
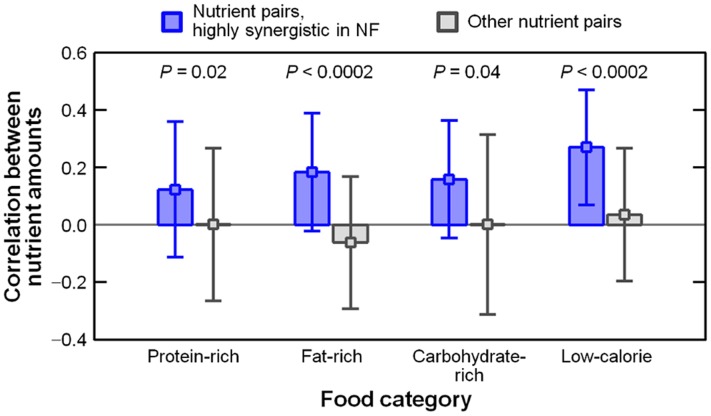
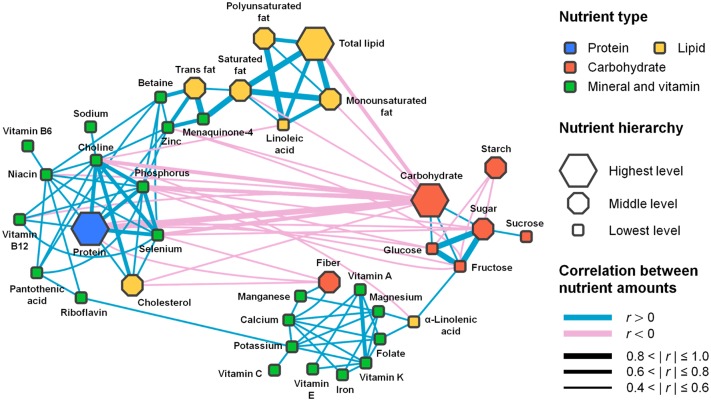
Recent progresses in data-driven analysis methods, including network-based approaches, are revolutionizing many classical disciplines. These techniques can also be applied to food and nutrition, which must be studied to design healthy diets. Using nutritional information from over 1,000 raw foods, we systematically evaluated the nutrient composition of each food in regards to satisfying daily nutritional requirements. The nutrient balance of a food was quantified and termed nutritional fitness; this measure was based on the food's frequency of occurrence in nutritionally adequate food combinations. Nutritional fitness offers a way to prioritize recommendable foods within a global network of foods, in which foods are connected based on the similarities of their nutrient compositions. We identified a number of key nutrients, such as choline and α-linolenic acid, whose levels in foods can critically affect the nutritional fitness of the foods. Analogously, pairs of nutrients can have the same effect. In fact, two nutrients can synergistically affect the nutritional fitness, although the individual nutrients alone may not have an impact. This result, involving the tendency among nutrients to exhibit correlations in their abundances across foods, implies a hidden layer of complexity when exploring for foods whose balance of nutrients within pairs holistically helps meet nutritional requirements. Interestingly, foods with high nutritional fitness successfully maintain this nutrient balance. This effect expands our scope to a diverse repertoire of nutrient-nutrient correlations, which are integrated under a common network framework that yields unexpected yet coherent associations between nutrients. Our nutrient-profiling approach combined with a network-based analysis provides a more unbiased, global view of the relationships between foods and nutrients, and can be extended towards nutritional policies, food marketing, and personalized nutrition.


Conflict of interest statement

Competing Interests: The authors have declared that no competing interests exist.

Figures

Fig 1
Fig 1. The food-food network.
(A–C) Large-scale to small-scale overviews of the network. Each node represents a food, and nodes are connected through links that reflect the similarities between the nutrient contents of foods. The network in (A) is composed of animal-derived (left) and plant-derived (right) foods. A part of the animal-derived foods is magnified in (B), which shows seven different clusters of foods. The members of one of these clusters, the cluster ‘Finfish (with some shellfish and poultry)’, are shown in (C). In (A–C), each node is colored according to the food category. The size of each node corresponds to the nutritional fitness (NF) of the food (Fig. 2A and 2B). For visual clarity, we only show the topologically-informative connections between the foods (represented by links with the same thickness), and we omit six foods that have loose connections to the network (see S1 Appendix, Section 3.3 for details).
Fig 2
Fig 2. Characteristics of nutritional fitness (NF).
(A) Flow chart for calculating NF. See S1 Appendix, Section 4.1 for the detailed procedures of the flow chart. At the end, we assign NF = log(f+1)/log(N+1) to each food, where f is the number of irreducible food sets that include the food, and N is the number of all irreducible food sets. An irreducible food set is defined as a set of different foods that satisfies the following two conditions: it meets our daily nutrient demands in its entirety, and no set is a superset of another set. We limit the number of different foods in each irreducible food set and the total weight of foods therein (Materials and Methods section). A large NF suggests that the food is nutritionally favorable. (B) NFs of foods, sorted in descending order. (C) NF versus price (per weight) for each food (gray). The blue line indicates the average prices along NFs. (D) NFs of foods (average and standard deviation) in each food cluster of the protein-rich category. Clusters are abbreviated as follows. F1: Finfish (with some shellfish and poultry); L: Animal liver; M: Milk; S: Shellfish (with some mollusks); E: Eggs; FP: Finfish and poultry (with some veal); PR: Pork (with some veal); B: Beef (with some lamb and poultry); F2: Finfish (mixed); PL: Poultry (with some beef and lamb).
Fig 3
Fig 3. Correlations between the abundances of two nutrients (one nutrient is favorable and the other nutrient is unfavorable for NF) across the foods in each food category.
For highly synergistic nutrient pairs (Φij > 2.0; blue) and the other pairs (Φij ≤ 2.0; grey), we present the respective averages and standard deviations of the correlations (see the Materials and Methods section and S1 Appendix, Section 6.2).
Fig 4
Fig 4. The nutrient-nutrient network.
Each node represents a nutrient, and the nodes are connected through correlations between the abundances of nutrients across all foods. The network is composed of three major groups of nutrients that are densely connected to one another through positive correlations. Between groups, nutrients have only sparsely positive or frequently negative correlations (S1 Appendix, Section 7.3): the top and left side is for the first group, the right side is for the second group, and the bottom side is for the third group. Each node is colored according to the nutrient type. The shape of each node indicates the hierarchical or ‘taxonomic’ level of a nutrient, from ‘Highest’ (a general class of nutrients) to ‘Lowest’ (a specific nutrient). The color and thickness of each link correspond to the sign and magnitude of the correlation, respectively. Here, we only show the significant nutrients and correlations described in S1 Appendix, Section 7.2, and we omit seven nutrients which don’t have significant correlations with any others. We also omit amino acids because their correlations with other nutrients are very similar to the correlations of the total protein with others (thus, these correlations are redundant for visualization).

References

    1. Drewnowski A (1997) Taste preferences and food intake. Annu Rev Nutr 17: 237–253. - PubMed
    1. De Irala-Estevez J, Groth M, Johansson L, Oltersdorf U, Prattala R, Martinez-Gonzalez MA. (2000) A systematic review of socio-economic differences in food habits in Europe: consumption of fruit and vegetables. Eur J Clin Nutr 54: 706–714. - PubMed
    1. Drewnowski A, Popkin BM (1997) The nutrition transition: new trends in the global diet. Nutr Rev 55: 31–43. - PubMed
    1. Kittler PG, Sucher KP (2008) Food and Culture, 5th Ed. California: Thomson Wadsworth.
    1. Wardle J, Parmenter K, Waller J (2000) Nutrition knowledge and food intake. Appetite 34: 269–275. - PubMed

Publication types

LinkOut - more resources