

doi: 10.1103/PhysRevLett.114.088101.
Epub 2015 Feb 23.
Transition to chaos in random networks with cell-type-specific connectivity
Affiliations
- PMID: 25768781
- PMCID: PMC4527561
- DOI: 10.1103/PhysRevLett.114.088101
Item in Clipboard
Transition to chaos in random networks with cell-type-specific connectivity
Phys Rev Lett.
.
Abstract
In neural circuits, statistical connectivity rules strongly depend on cell-type identity. We study dynamics of neural networks with cell-type-specific connectivity by extending the dynamic mean-field method and find that these networks exhibit a phase transition between silent and chaotic activity. By analyzing the locus of this transition, we derive a new result in random matrix theory: the spectral radius of a random connectivity matrix with block-structured variances. We apply our results to show how a small group of hyperexcitable neurons within the network can significantly increase the network's computational capacity by bringing it into the chaotic regime.
Figures
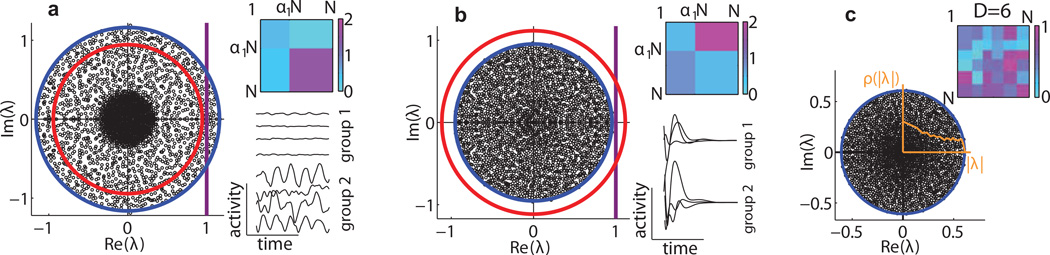
Spectra and dynamics of networks with cell-type dependent connectivity (N = 2500). The support of the spectrum of the connectivity matrix J is accurately described by (radius of blue circle) for different networks. Top insets - the synaptic gain matrix G summarizes the connectivity structure. Bottom insets - activity of representative neurons from each type. The line ℜ{λ} = 1 (purple) marks the transition from quiescent to chaotic activity. (a) An example chaotic network with two cell-types. The average synaptic gain ḡ (radius of red circle) incorrectly predicts this network to be quiescent. (b) An example silent network. Here ḡ incorrectly predicts this network to be chaotic. (c) An example network with six cell-types. In all examples the radial part of the eigenvalue distribution ρ(|λ|) (orange line) is not uniform [22].
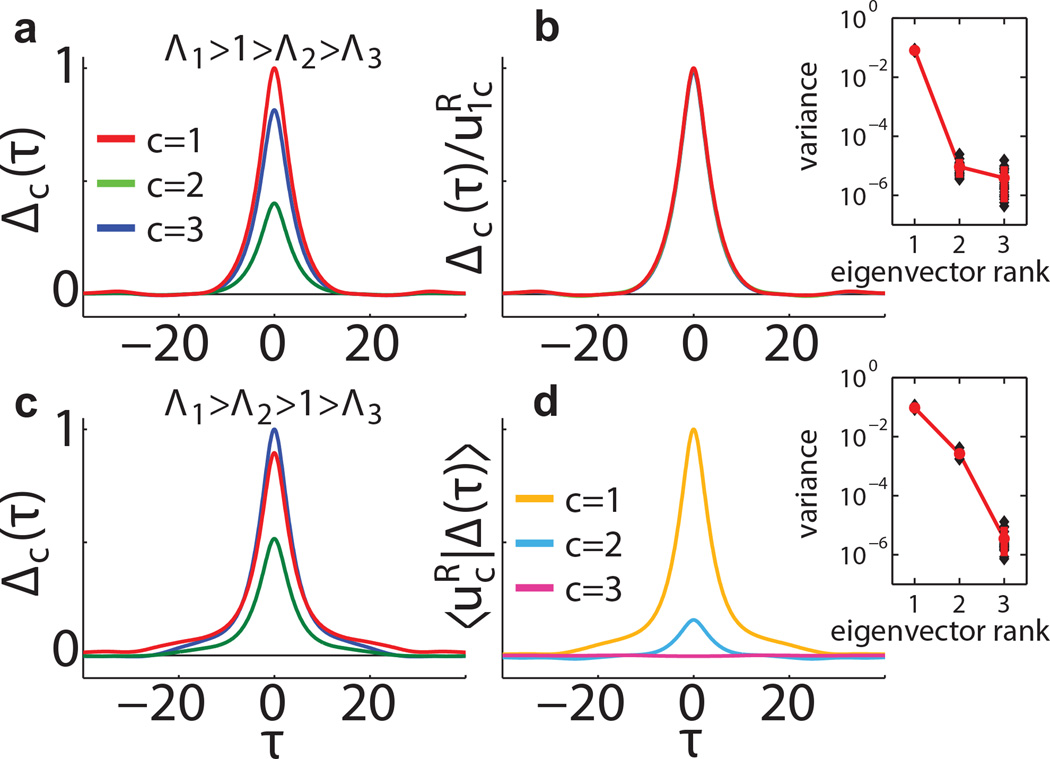
Autocorrelation modes. Example networks (N = 1200) have 3 equally sized groups with α, g such that M is symmetric. (a) When D* = 1 autocorrelations maintain a constant ratio independent of τ. (b) Rescaling by the components collapses the autocorrelation functions (Here Λ1 = 20, Λ2 = 0.2, Λ3 = 0.1). (c) When D* = 2, the autocorrelation functions are linear combinations of two autocorrelation “modes” that decay on different timescales. Projections of these functions are shown in (d). Only projections on are significantly different from 0 (Here Λ1 = 20, Λ2 = 16, Λ3 = 0.1). Insets show the variance of Δ (τ) projected on averaged over 20 networks in each setting.
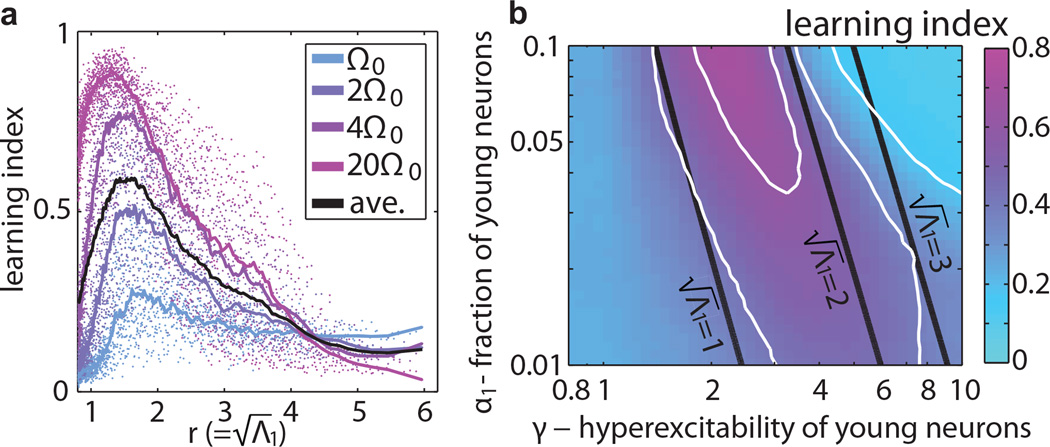
Learning capacity is primarily determined by , the effective gain of the network. (a) The learning index for four pure frequency target functions (Ω0 = π/120) plotted as a function of the radius . The training epoch lasted approximately 100 periods of the target signal. Each point is an average over 25 networks with N = 500, ε = 0.2 and different values of α1 and γ. The line is a moving average of these points for each frequency. (b) The same data averaged over the target frequencies shown as a function of γ and α1. Contour lines of lΩ (white) and of (black) coincide approximately in the region where lΩ peaks.
References
-
- Mehta ML. Random Matrices. Elsevier Academic Press; 2004.
-
- Izyumov YA. Adv. Phys. 1965;14:569.
-
- Kosterlitz JM, Thouless DJ, Jones RC. Phys. Rev. Lett. 1976;36:1217.
-
- Wishart J. Biometrika. 1928;20A:32.
-
- Amari S-I. Systems, Man and Cybernetics, IEEE Transactions on. 1972:643.
Publication types
MeSH terms
Grants and funding
LinkOut - more resources
Full Text Sources