. 2015 Mar 12;160(6):1072-86.
doi: 10.1016/j.cell.2015.02.035.

Human disease modeling reveals integrated transcriptional and epigenetic mechanisms of NOTCH1 haploinsufficiency

Affiliations

Human disease modeling reveals integrated transcriptional and epigenetic mechanisms of NOTCH1 haploinsufficiency

Christina V Theodoris et al. Cell. .

Abstract

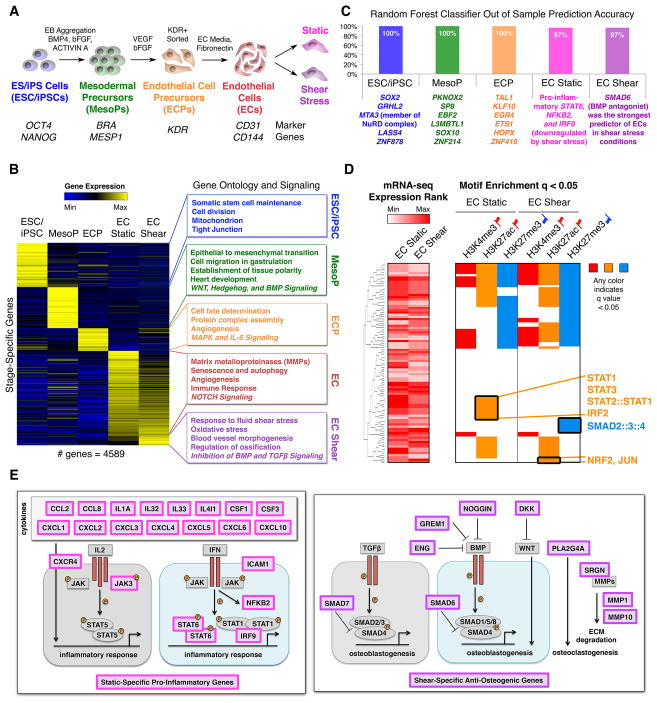
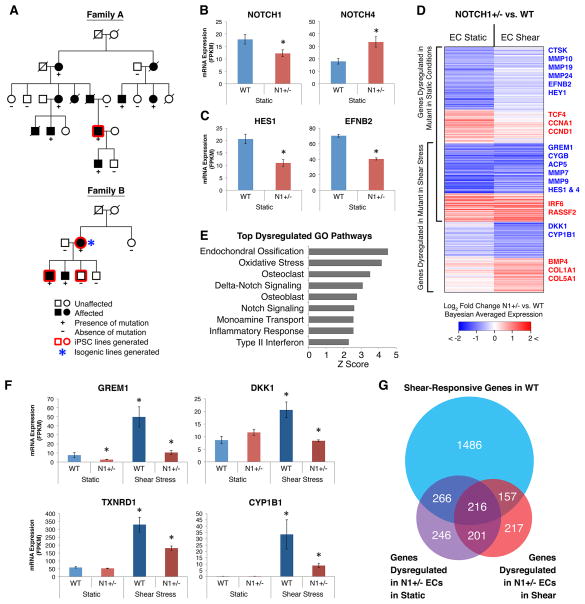
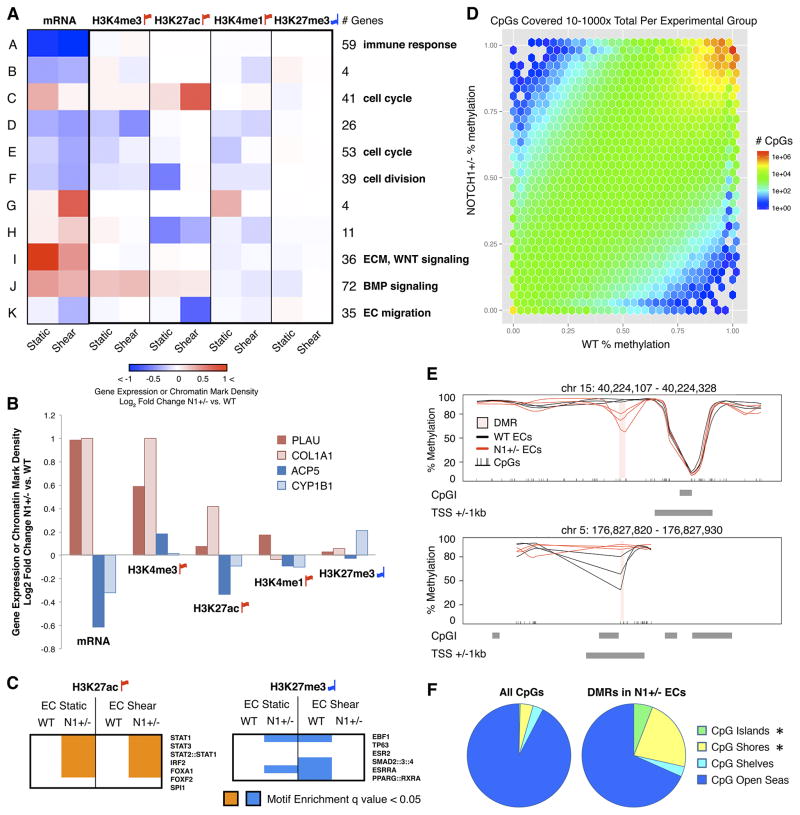
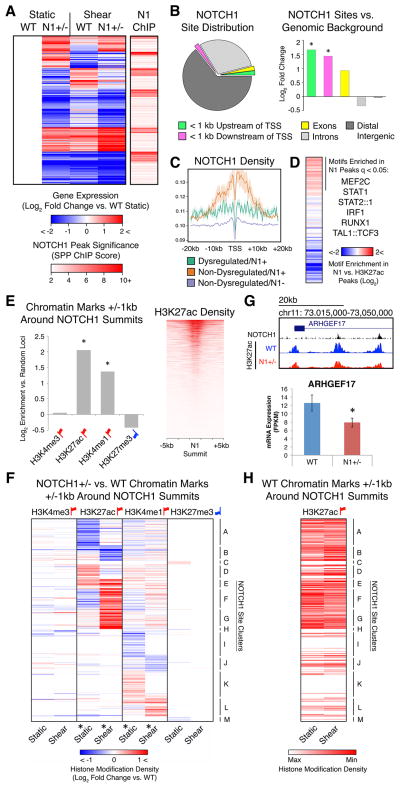
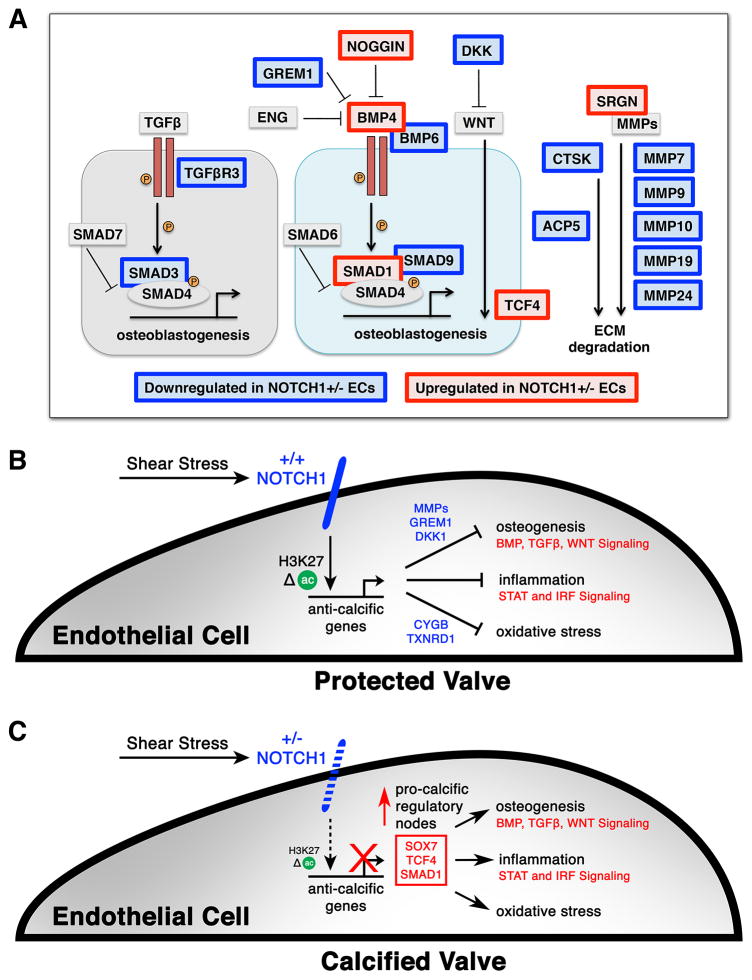
The mechanisms by which transcription factor haploinsufficiency alters the epigenetic and transcriptional landscape in human cells to cause disease are unknown. Here, we utilized human induced pluripotent stem cell (iPSC)-derived endothelial cells (ECs) to show that heterozygous nonsense mutations in NOTCH1 that cause aortic valve calcification disrupt the epigenetic architecture, resulting in derepression of latent pro-osteogenic and -inflammatory gene networks. Hemodynamic shear stress, which protects valves from calcification in vivo, activated anti-osteogenic and anti-inflammatory networks in NOTCH1(+/+), but not NOTCH1(+/-), iPSC-derived ECs. NOTCH1 haploinsufficiency altered H3K27ac at NOTCH1-bound enhancers, dysregulating downstream transcription of more than 1,000 genes involved in osteogenesis, inflammation, and oxidative stress. Computational predictions of the disrupted NOTCH1-dependent gene network revealed regulatory nodes that, when modulated, restored the network toward the NOTCH1(+/+) state. Our results highlight how alterations in transcription factor dosage affect gene networks leading to human disease and reveal nodes for potential therapeutic intervention.


Figures

Figure 1
Figure 1. Transcriptional Mechanisms in EC Differentiation and Response to Shear Stress
(A) Stages of EC differentiation analyzed. (B) Unique signature of EC differentiation stages by RNA-seq. Stage-unique genes were expressed most highly at the given stage and significantly upregulated relative to immediately preceding or following stages. p < 0.05 by negative binomial test with false discovery rate (FDR) correction. (C) Top stage-predictive TFs identified by random forest classifier. (D) Left: Expression of TFs whose motifs were tested in the corresponding rows on the right. Right: Motif enrichment within activating or repressive chromatin marks in ECs exposed to static or shear stress conditions suggesting activated or repressed signaling pathways. Any color indicates significant motif enrichment (q < 0.05) by motif Diverge with FDR correction while white indicates non-significance. Red up flags: activating marks; blue down flags: repressive marks. (E) Left: Diagram of static-specific pro-inflammatory genes (pink). Right: Diagram of shear-specific anti-osteogenic genes (violet). In (B–D): n = 5. See also Figure S1 and Table S1–2.
Figure 2
Figure 2. Correlation of Dynamic Chromatin Patterns with Transcriptional Transitions
(A) Hierarchical clustering of mRNA expression. (B) Hierarchical clustering of genes based on enrichment of histone modifications within 1 kb of the TSS. Color indicates mean enrichment for each gene cluster. Red up flags: activating marks; blue down flags: repressive marks. (C) The overlap of genes within expression clusters (horizontal axis) and chromatin clusters (vertical axis). Color represents X2 residuals (any yellow indicates significant overlap between genes in the corresponding expression and chromatin cluster). (D) Histone modification enrichment around TAL1 (Cluster J) during EC differentiation. In (A–D): n = 5. See also Figure S1 and Table S3–4.
Figure 3
Figure 3. Gene Networks Dysregulated in N1 Haploinsufficient Isogenic iPSC-derived ECs
(A) Pedigrees of two families affected with congenital heart disease and valve calcification due to N1 mutations. Squares, males; circles, females. (B) mRNA expression of N1 and compensatory upregulation of NOTCH4. (C) mRNA expression of canonical N1 targets HES1 and EFNB2. (D) Log2 fold change in mRNA expression in N1+/− vs. WT ECs in static and shear stress conditions of 1303 genes significantly dysregulated in N1+/− ECs. (E) Top GO pathways enriched among genes dysregulated in N1+/− ECs. (F) Examples of anti-osteogenic (GREM1, DKK1), antioxidant (TXNRD1), and anti-atherogenic (CYP1B1) shear-responsive genes not properly activated in N1+/− ECs. (G) Overlap of statistically significant gene sets. In (B–G): WT n = 3, N1+/− n = 2 (isogenic ECs); error bars represent standard error; *p < 0.05 by negative binomial test with FDR correction. See also Figures S2–S5 and Table S5–6.
Figure 4
Figure 4. Epigenetic Dysregulation in N1+/− ECs
(A) Hierarchical clustering of genes based on log2 fold change of expression and enrichment of histone modifications within 3 kb (H3K4me3) or 15 kb (H3K27ac, H3K4me1, H3K27me3) of the TSS in N1+/− vs. WT ECs. Enriched GO pathways within each cluster are shown on the right. (B) Mean log2 fold change in N1+/− vs. WT static ECs of mRNA expression and histone modifications as in (A) of individual pro-osteogenic (PLAU, COL1A1), osteoclast (ACP5), and anti-atherogenic (CYP1B1) genes. (C) TF motif enrichment in N1+/− vs. WT chromatin marks in static or shear stress conditions. Motifs tested were drawn from unique clusters identified in Figure 1D. (D) Relative mean DNA methylation of CpGs in N1+/− (vertical axis) vs. WT (horizontal axis) ECs in static conditions. Plot includes only CpGs covered 10–1000x total between three biological replicates per experimental group. (E) Examples of the 248 DMRs identified in N1+/− vs. WT ECs. (F) Distribution of DMRs or all CpGs relative to CpGIs. Shores are < 2 kb flanking CpGIs; shelves are < 2kb flanking outwards from shores; open seas are > 4 kb flanking CpGIs. *p <0.05 by X2 test with Bonferroni correction. In (A–C): WT n = 5, N1+/− n = 3 (patient-specific ECs). Red up flags: activating marks; blue down flags: repressive marks. In (D–F): WT n = 3, N1+/− n = 3 (patient-specific ECs). See also Figures S6 and Table S7.
Figure 5
Figure 5. Transcriptional and Epigenetic Dysregulation Directly Associated with N1 Genome Occupancy
(A) Left: K means clustering of putative direct N1 targets defined as genes significantly dysregulated in N1+/− ECs with N1 ChIP peaks within 20 kb of the TSS. Right: Significance of N1 peaks within 20 kb of the TSS of 414 putative direct N1 targets. (B) Left: Distribution of N1 peaks. Right: Log2 fold change of proportion of N1 peaks vs. genomic background in indicated regions. *p < 0.05 by X2 test with Bonferroni correction. (C) N1 density around the TSS of genes dysregulated in N1 haploinsufficiency with N1 peaks within 20 kb (green), non-dysregulated genes with N1 peaks within 20 kb (orange), or non-dysregulated genes without N1 peaks within 20 kb (blue). (D) Motifs significantly enriched (q < 0.05 by motif Diverge with FDR correction) within 25 bps of N1 peak summits compared to H3K27ac peaks in ECs in static conditions. (E) Left: Log2 fold change of overlap of chromatin marks in WT ECs with 1 kb around N1 summits vs. random non-gap genomic loci. *p < 0.05 by X2 test with Bonferroni correction. Right: H3K27ac density near N1 summits. (F) Hierarchical clustering based on log2 fold change of N1+/− vs. WT histone modification density within 1 kb of N1 summits. *p < 0.05 by KS test with Bonferroni correction (histone modification dysregulation around N1 summits vs. random non-gap genomic loci). (G) Top: N1 peaks and WT or N1+/− H3K27ac near ARHGEF17. Bottom: Mean mRNA expression of ARHGEF17. Error bars represent standard error; *p < 0.05 by negative binomial test with FDR correction. (H) Relative H3K27ac density within 1 kb of N1 summits ordered as in (F) in WT ECs in static or shear stress conditions. In (A–H): Gene expression: WT n = 3, N1+/− n = 2 (isogenic iPSC-derived ECs). Chromatin marks: WT n = 5, N1+/− n = 3 (patient-specific iPSC-derived ECs). N1 genome occupancy: WT n = 1 (union of 3 technical replicates) (primary HAECs). Red up flags: activating marks; blue down flags: repressive marks. See also Figure S6.
Figure 6
Figure 6. Manipulation of Dysregulated Regulatory Nodes to Restore the EC Gene Network
(A) Putative regulatory nodes directly connected to N1 in the predicted network and their interconnections (p < 0.05). (B) Predicted gene regulatory network in ECs (p < 0.05) with each circle representing a gene and color indicating log2 fold change of N1+/− vs. WT expression in shear stress conditions. Boxed genes are putative dysregulated regulatory nodes with red and blue boxes indicating up-or downregulated genes, respectively. (C) Histogram of number of nodes with different numbers of connected dysregulated genes. A small number of master regulators may control the majority of dysregulated genes. (D) Effect of control, SOX7, TCF4, and/or SMAD1 siRNA on N1+/− EC mRNA expression of indicated genes as detected by QPCR. (E) Gene regulatory subcircuit assembled based on perturbation results and network prediction. (F) Effect of combined SOX7 and TCF4 siRNA on restoring N1+/− vs. WT expression of 48 genes dysregulated in N1 haploinsufficiency. N = 2. See also Figure S7.
Figure 7
Figure 7. Model of Mechanisms Regulating Pro-Calcific Events in N1 Haploinsufficient ECs
(A) Diagram of osteogenic pathways dysregulated in N1 haploinsufficiency. Red indicates upregulation in N1+/− ECs and blue indicates downregulation in N1+/− ECs. (B) Model of WT ECs. Shear stress activates N1 signaling in ECs, leading to epigenetic changes at N1-bound enhancers and transcriptional activation of anti-calcific gene programs that prevent osteogenesis, inflammation, and oxidative stress to protect the valve from calcification. (C) Model of N1+/− ECs, which cannot mediate the proper response to shear stress, leading to epigenetic dysregulation at N1-responsive enhancers and aberrant upregulation of pro-calcific regulatory nodes.

Comment in

References

    1. Alatalo SL, Halleen JM, Hentunen TA, Mönkkönen J, Väänänen HK. Rapid screening method for osteoclast differentiation in vitro that measures tartrate-resistant acid phosphatase 5b activity secreted into the culture medium. Clin Chem. 2000;46:1751–1754. - PubMed
    1. Bragdon B, Moseychuk O, Saldanha S, King D, Julian J, Nohe A. Bone morphogenetic proteins: a critical review. Cell Sig. 2011;23:609–620. - PubMed
    1. Combs MD, Yutzey KE. Heart valve development: Regulatory networks in development and disease. Circ Res. 2009;105:408–421. - PMC - PubMed
    1. Conway DE, Sakurai Y, Weiss D, Vega JD, Taylor WR, Jo H, Eskin SG, Marcus CB, McIntire LV. Expression of CYP1A1 and CYP1B1 in human endothelial cells: Regulation by fluid shear stress. Cardiovasc Res. 2009;81:669–677. - PMC - PubMed
    1. Deleuze V, El-Hajj R, Chalhoub E, Dohet C, Pinet V, Couttet P, Mathieu D. Angiopoietin-2 is a direct transcriptional target of TAL1, LYL1, and LMO2 in endothelial cells. PLoS ONE. 2012;7:e40484. - PMC - PubMed

Publication types