. 2015 Mar 12;160(6):1111-24.
doi: 10.1016/j.cell.2015.02.029.

Codon optimality is a major determinant of mRNA stability

Affiliations

Codon optimality is a major determinant of mRNA stability

Vladimir Presnyak et al. Cell. .

Abstract

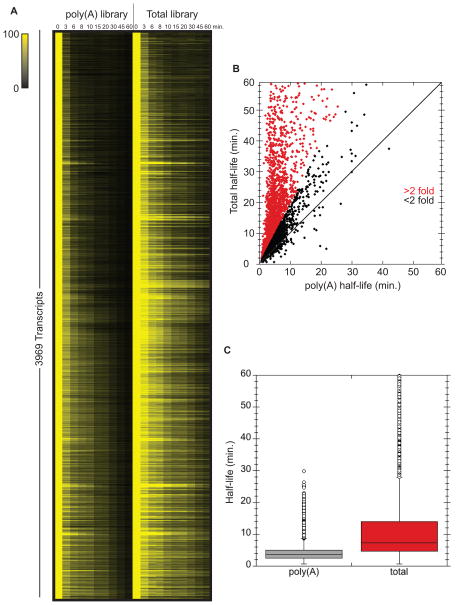
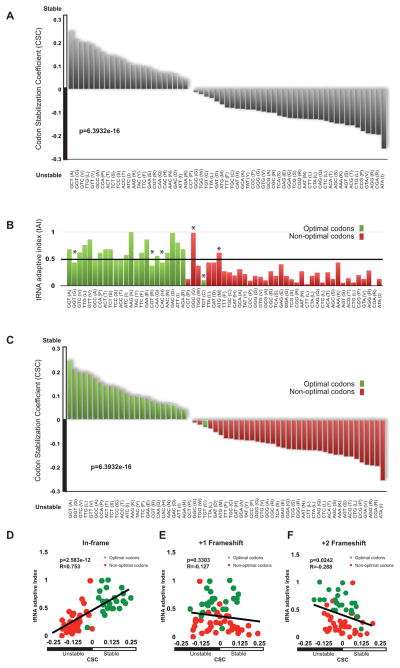
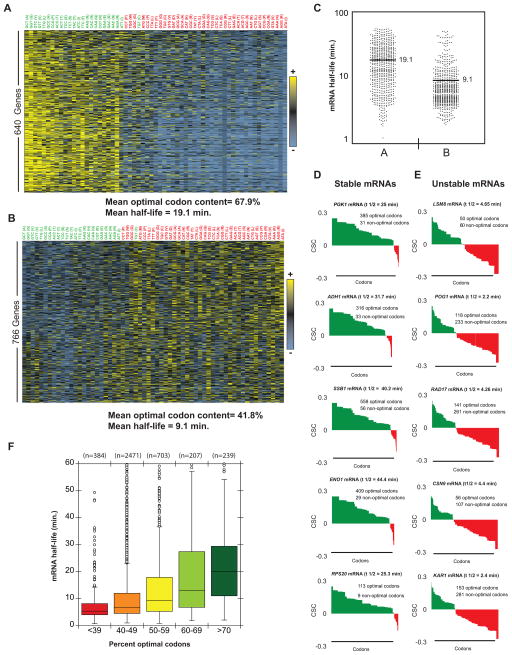
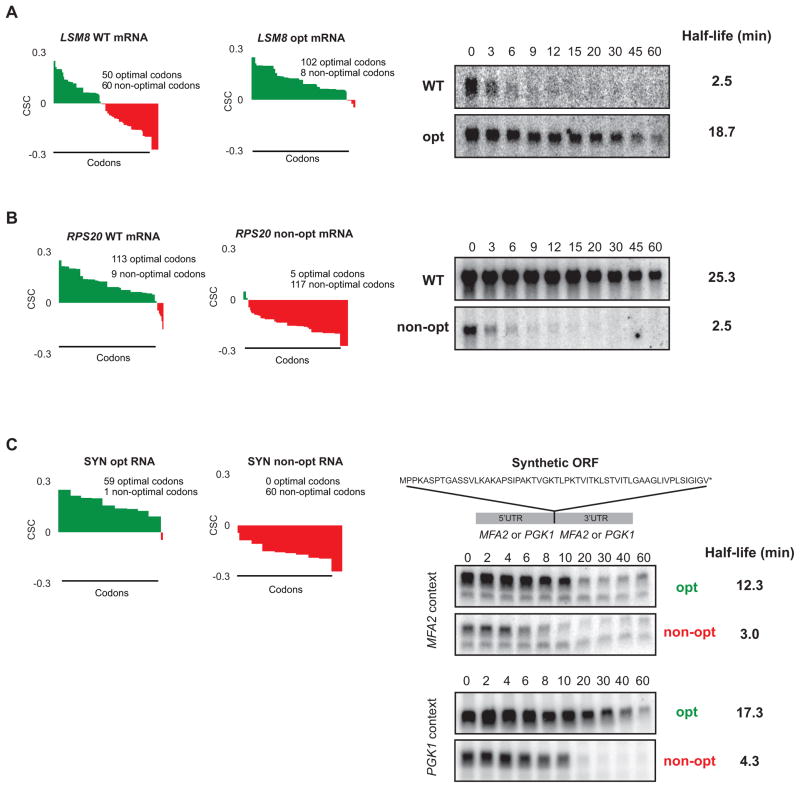
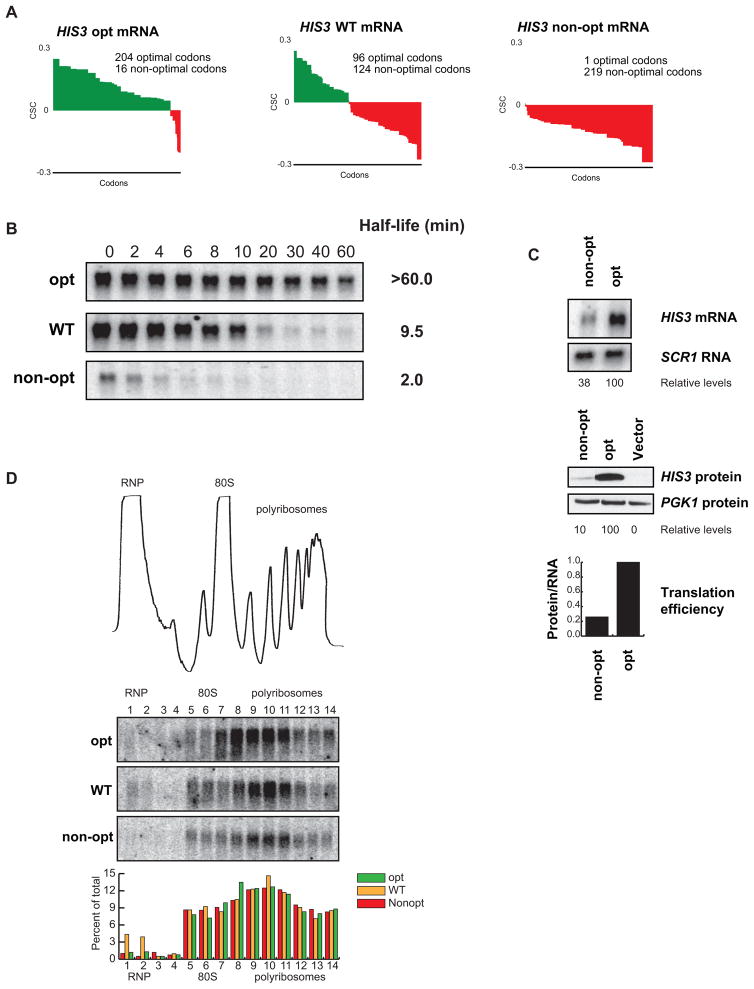
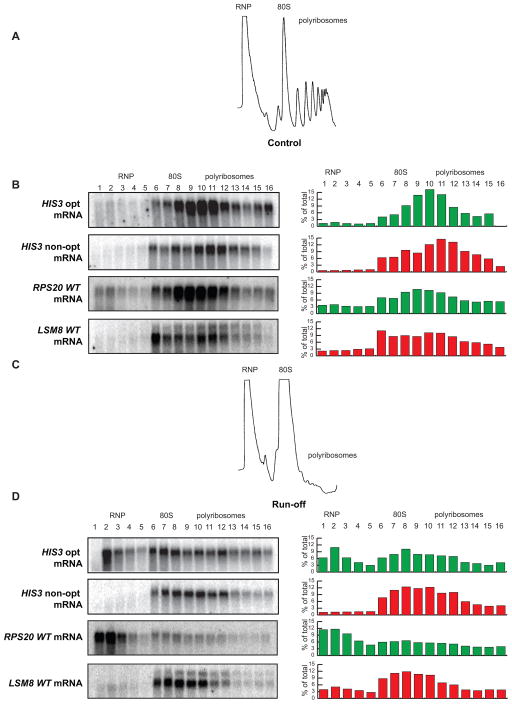
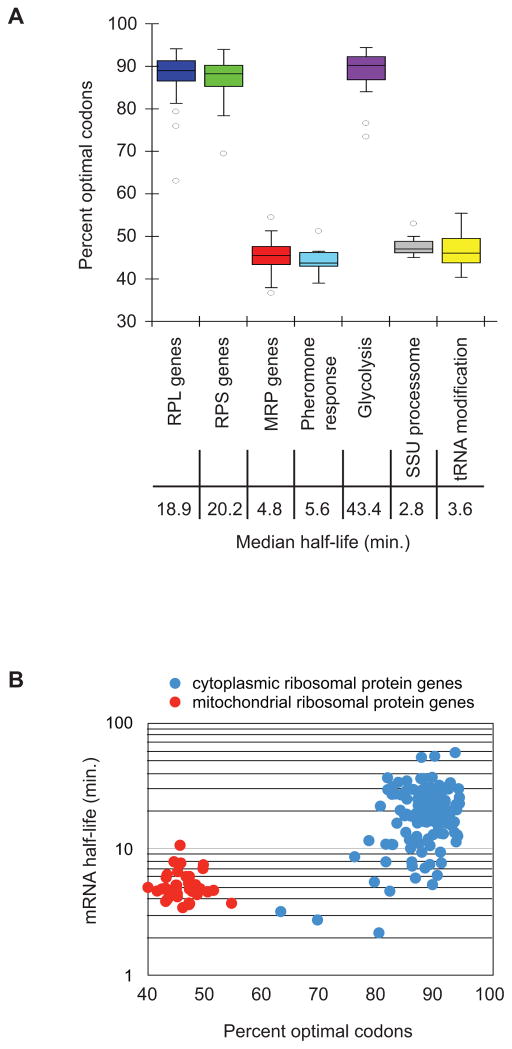
mRNA degradation represents a critical regulated step in gene expression. Although the major pathways in turnover have been identified, accounting for disparate half-lives has been elusive. We show that codon optimality is one feature that contributes greatly to mRNA stability. Genome-wide RNA decay analysis revealed that stable mRNAs are enriched in codons designated optimal, whereas unstable mRNAs contain predominately non-optimal codons. Substitution of optimal codons with synonymous, non-optimal codons results in dramatic mRNA destabilization, whereas the converse substitution significantly increases stability. Further, we demonstrate that codon optimality impacts ribosome translocation, connecting the processes of translation elongation and decay through codon optimality. Finally, we show that optimal codon content accounts for the similar stabilities observed in mRNAs encoding proteins with coordinated physiological function. This work demonstrates that codon optimization exists as a mechanism to finely tune levels of mRNAs and, ultimately, proteins.


Figures

Figure 1
Figure 1. Half-lives calculated from poly(A)+ vs total mRNA differ significantly
RNA-seq was performed on poly(A)+ and total RNA libraries prepared from rpb1-1 transcriptional shut-off experiments across a 60 minute time course. (A) All mRNAs with reliable half-lives in both libraries are plotted visually. Color intensity represents normalized mRNA remaining (time 0 is set to 100% for each mRNA). (B) Half-life of each mRNA plotted as calculated from total mRNA sequencing against the poly(A) sequencing. Data points with a >2 fold difference are highlighted in red. (C) Overview of the distribution of half-lives for both libraries. See also Table S1.
Figure 2
Figure 2. Codon composition correlates with stability
(A) The Codon occurrence to mRNA Stability Correlation coefficient (CSC) plotted for each codon as calculated from the total RNA data set. The CSC is the R-value of the correlation between the occurrences of that codon and the half-lives of mRNA. Overall p-value is 6.3932e-16, permutation p-value is < 10−4. (B) tRNA Adaptability Index values for each codon plotted in the same order as (A). Codon optimality as defined in Pechmann and Frydman (2013) is color coded, using green for optimal codons and red for non-optimal codons. Codons designated with an asterisk (*) were called optimal or non-optimal according to additional criteria discussed therein. (C) The Codon occurrence to mRNA Stability Correlation coefficient (CSC) plotted for each codon as in (A), but optimality information presented in (B) is added by color-coding. Green color represents optimal codons and red represents non-optimal. (D) tRNA Adaptive Index values plotted vs CSC when ORFs are considered in-frame. Green indicates optimal codons, red indicates non-optimal codons (R = .7255, p-value is p-value = 2.075e-09, permutation p-value < 10−4) (E) tRNA Adaptive Index values plotted vs CSC when ORFs are frameshifted by one nucleotide. Green indicates optimal codons, red indicates non-optimal codons. (F) tRNA Adaptive Index values plotted vs CSC when ORFs are frameshifted by two nucleotides. Green indicates optimal codons, red indicates non-optimal codons. See also Figure S1.
Figure 3
Figure 3. Multiple codons are enriched in stable and unstable mRNA classes
(A) Heat map of a class of relatively stable mRNAs with similar codon usage. Each column represents the usage of a single codon, with each row representing one mRNA. Yellow indicates above average usage of that codon, blue represents below average usage. See Fig. S4 for full heat map. (B) As (A), but showing a relatively unstable class of mRNAs. (C) Dot plot showing the distribution of half-lives in the mRNA classes shown in (A, B). (D) Codon optimality diagrams in selected stable mRNAs. Genes are broken down and plotted as individual codons. Codons are presented in order of optimality rather than in their natural order. Higher bars represent more optimal codons (CSC on y-axis). Green indicates optimal codons, red indicates non-optimal codons. (E) Codon optimality diagrams in selected unstable mRNAs, as in (D). (F) Box plot of mRNAs half-lives separated into optimality groups. Half of the data fall within the boxed section, with the whiskers representing the rest of the data. Data points falling further than 1.5 fold the interquartile distance are considered outliers. See also Figure S2.
Figure 4
Figure 4. Stability of mRNAs can be controlled by altering codon optimality
(A) Codon optimality diagram of LSM8 (as Fig. 3E), a naturally non-optimal mRNA shown. LSM8 OPT is a synonymously substituted version of LSM8 engineered for higher optimality. Northern blots of rpb1-1 shut-off experiments are shown on the right with half-life of both reporters. Quantitation is normalized to SCR1 loading controls not shown. (B) As (A), except a naturally optimal mRNA, RPS20 (as in Fig. 3D), has been engineered for lower optimality as RPS20 non-opt. Northern blots of rpb1-1 shut-off experiments are shown on the right with half-life of both messages. Quantitation is normalized to SCR1 loading controls not shown. (C) Codon optimality diagrams showing a synthetic mRNA (SYN) encoding the polypeptide shown. Peptide is artificially engineered and has no similarity to any known proteins. SYN opt and non-opt were both inserted into flanking regions from a stable transcript (PGK1) and unstable transcript (MFA2). Northern blots on the right show GAL shut-off experiments demonstrating stability of the SYN mRNA in context of the MFA2 and PGK1 flanking sequences. Quantitation is normalized to SCR1 loading controls not shown. See also Figure S3.
Figure 5
Figure 5. Optimality can affect translation and stability of an mRNA without changes in ribosome association
(A) Codon optimality diagram of HIS3, a transcript with an intermediate half-life, as well as versions engineered with synonymous substitutions to contain higher and lower percent optimal codons, HIS3 opt and HIS3 non-opt respectively. (B) Northern blots of rpb1-1 shut-off experiments are shown with half-lives of all three messages. Quantitation is normalized to SCR1 loading controls not shown. (C) Northern and western blots for steady state concentrations of the optimal and non-optimal versions of HIS3. Loading controls and quantitation are shown below. Translational efficiency is calculated as relative protein levels divided by relative mRNA levels and plotted at the bottom. (D) A trace of sucrose density gradient analysis, along with northern blot analysis of the gradient fractions. The blots show location of the three HIS3 reporters within the gradient. Quantitation for each fraction is shown below.
Figure 6
Figure 6. Optimal and non-optimal transcripts are retained differently on polysomes
(A) Representative A260 trace of sucrose density gradient analysis demonstrating normal distribution into RNP, 80S, and polyribosome fractions. (B) Distribution of the optimal and non-optimal HIS3 reporters and the RPS20 and LSM8 mRNAs in the sucrose density gradients under normal conditions showing localization primarily in the polyribosome fractions. (C) Representative A260 trace of sucrose density gradient analysis under run-off conditions, showing collapse of the polyribosome fractions. (D) Distribution of the optimal and non-optimal HIS3 reporters and the RPS20 and LSM8 mRNAs under run-off conditions, demonstrating differential relocation.
Figure 7
Figure 7. Functionally related genes display similar optimality
(A) Groups of genes whose protein products have related functions are plotted to show their optimality. Half of the data fall within the boxed section, with the whiskers representing the rest of the data. Data points falling further than 1.5 fold the interquartile distance are considered outliers. Represented gene groups are: 70 RPL (large ribosomal subunit proteins) genes, 54 RPS (small ribosomal subunit proteins) genes, 42 MRP (mitochondrial ribosomal proteins) genes, 14 pheromone response genes, 10 glycolysis enzymes, 15 SSU (small subunit processosome) genes, 12 tRNA processing genes. (B) Breakdown of two groups to show relationship between optimal codon content and half-life within the groups. mRNA half-life for each protein in the cytoplasmic ribosome and the mitochondrial ribosome is plotted against the optimal codon content of that mRNA.

References

    1. Akashi H. Synonymous codon usage in Drosophila melanogaster: natural selection and translational accuracy. Genetics. 1994;136:927–935. - PMC - PubMed
    1. Caponigro G, Muhlrad D, Parker R. A small segment of the MAT alpha 1 transcript promotes mRNA decay in Saccharomyces cerevisiae: a stimulatory role for rare codons. Mol Cell Biol. 1993;13:5141–5148. - PMC - PubMed
    1. Charneski CA, Hurst LD. Positively charged residues are the major determinants of ribosomal velocity. PLoS Biol. 2013;11(3):e1001508. - PMC - PubMed
    1. Coller J, Parker R. Eukaryotic mRNA decapping. Annu Rev Biochem. 2004;73:861–890. - PubMed
    1. Coller J, Parker R. General translational repression by activators of mRNA decapping. Cell. 2005;122:875–886. - PMC - PubMed

Publication types