. 2015 Mar 12;160(6):1135-44.
doi: 10.1016/j.cell.2015.02.001.

Asymmetric unwrapping of nucleosomes under tension directed by DNA local flexibility

Affiliations

Asymmetric unwrapping of nucleosomes under tension directed by DNA local flexibility

Thuy T M Ngo et al. Cell. .

Abstract

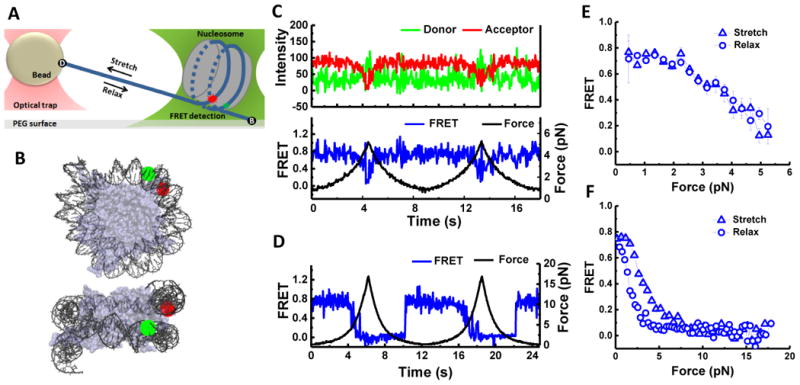
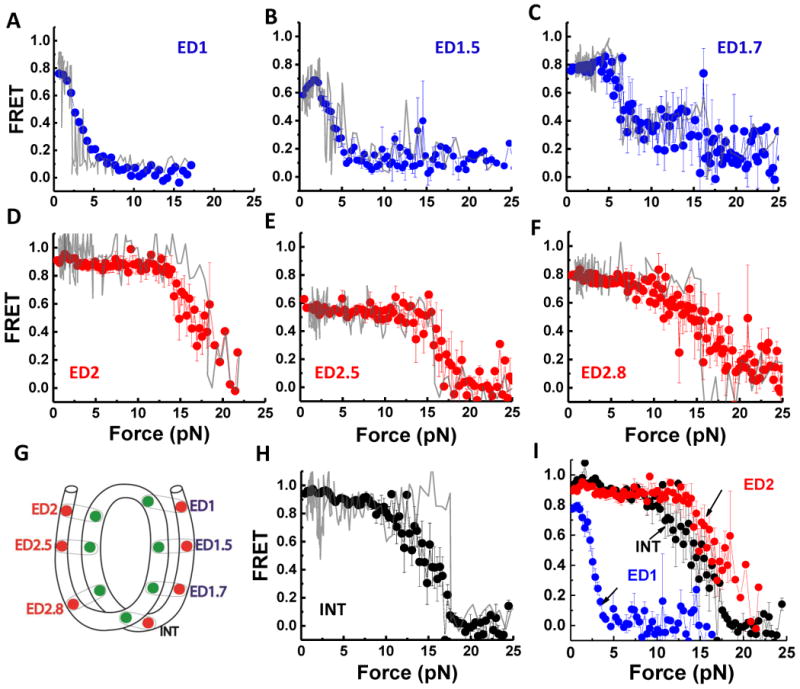
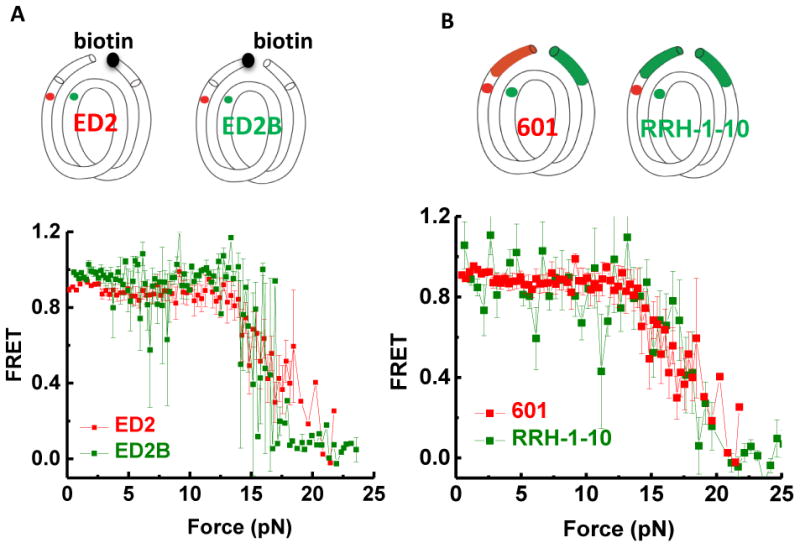
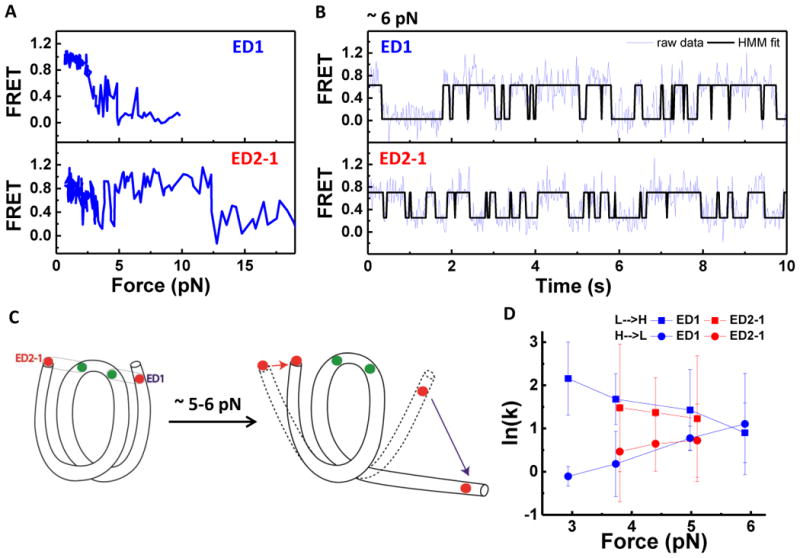
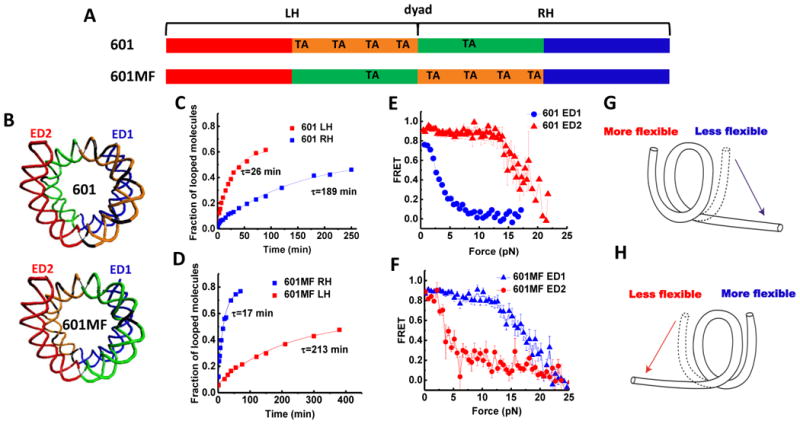
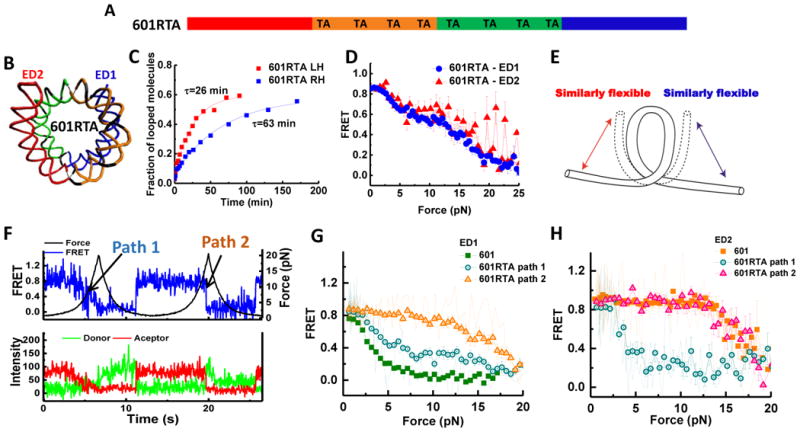
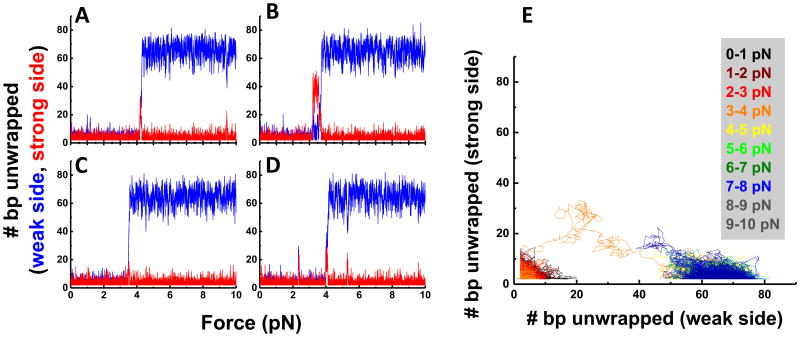
Dynamics of the nucleosome and exposure of nucleosomal DNA play key roles in many nuclear processes, but local dynamics of the nucleosome and its modulation by DNA sequence are poorly understood. Using single-molecule assays, we observed that the nucleosome can unwrap asymmetrically and directionally under force. The relative DNA flexibility of the inner quarters of nucleosomal DNA controls the unwrapping direction such that the nucleosome unwraps from the stiffer side. If the DNA flexibility is similar on two sides, it stochastically unwraps from either side. The two ends of the nucleosome are orchestrated such that the opening of one end helps to stabilize the other end, providing a mechanism to amplify even small differences in flexibility to a large asymmetry in nucleosome stability. Our discovery of DNA flexibility as a critical factor for nucleosome dynamics and mechanical stability suggests a novel mechanism of gene regulation by DNA sequence and modifications.


Figures

Figure 1
Figure 1. Observation of Local Conformational Changes of Nucleosome under Tension
(A) Experimental scheme: a nucleosome was immobilized on a microscope slide via a 14 bp dsDNA handle beyond the nucleosome core sequence. The other end was connected to a micron-diameter bead through a λ-DNA linker which was held in place by an optical trap which applies force. Local conformational changes were recorded by FRET between the donor (green) and the acceptor (red) on the DNA. (B) Positions of donor and acceptor fluorophores in the ED1-labeling scheme superposed on two different views of the nucleosome structure (Protein Data Bank [PDB] file 3MVD). (C and D) Single-molecule time traces of the ED1 construct recorded during stretching and relaxing at a stage speed of 455 nm/s at a set maximum force of ∼ 6 pN (C) and ∼ 20 pN (D): force (black), donor signal (green), acceptor signal (red), and FRET efficiency (blue). (E and F) The average FRET versus force when the maximum force was set to ∼ 6 pN (E): average of 26 traces and ∼ 20 pN (F): average of 25 traces. See also Figure S1.
Figure 2
Figure 2. Nucleosome Unwraps Directionally under Tension
(A-H) FRET vs. force during stretching for various FRET pairs spanning two sides of the nucleosome illustrated in (G) (see Figure S2 for labeling positions). Representative data for single cycles are shown in gray. The averaged curves are in blue for the weak side, in red for the strong side, and in black for the inner turn probes. Error bars are SEM of 25 traces for ED1 (A), 15 traces for ED1.5 (B), 8 traces for ED1.7 (C), 20 traces for ED2 (D), 7 traces for ED2.5 (E), 40 traces for ED2.8 (F), and 22 traces for INT (H). (I) Overlay of ED1, ED2, and INT stretching curves. Substeps, which may arise from progressive unwrapping, could be seen for ED1.7 both in the averaged trace and in individual traces (three out of eight cycles). See also Figure S2.
Figure 3
Figure 3. Unwrapping Force Is Not Affected by Pulling Configuration or Extra-Nucleosomal Handle Sequence
(A) Switched pulling configurations for the same labeling position ED2. In the ED2 scheme, the 5′ end of the bottom J strand (the right end) is biotinylated. In the ED2B scheme, the 5′ end of the top I strand (the left end) is biotinylated. Averaged stretching traces for both ED2 pulling configurations show identical high force required for unwrapping (ED2: average of 20 traces, ED2B: average of 4 traces). (B) Changing the handle sequence on the left side does not alter the high force range required to open nucleosomal DNA on this side. Averaged stretching curves show identical high force required for unwrapping for 601-ED2 (average of 20 traces) and RRH-1-10-ED2 (average of 15 traces). See also Figure S3.
Figure 4
Figure 4. Coordinated Dynamics of the Two Nucleosomal DNA Ends
(A) Representative single-molecule stretching traces of ED1 and ED2-1 as indicated in C. (B) Representative time traces of FRET efficiency at a constant force of 6 pN, showing hopping between high and low FRET states. Fits from Hidden Markov modeling are overlaid. (C) Illustration of how major unwrapping of one side of the nucleosome facilitates rewrapping on the other end. Initially, two extreme ends of the nucleosome synchronously unwrap and rewrap at forces below ∼ 5pN (dashed shape). Once the ED1 side majorly unwraps (blue arrow), this facilitates the rewrapping of the ED2 side (red arrow). (D) Rates of transition between high and low FRET states vs. force. Unwrapping rates (high to low FRET transitions) in circles and rewrapping rates (low to high FRET transitions) in squares. See also Figure S4.
Figure 5
Figure 5. Asymmetric Nucleosome Unwrapping Controlled by DNA Local Flexibility
(A) Variations of the 601 the sequence where the inner quarters are colored in orange and green and the outer quarters are colored in red and blue. TA steps are indicated. (B) Nucleosomal DNA structures are shown in the same color scheme with corresponding scheme of the sequence. (C and D) Single exponential fits to the looped DNA fraction versus time yield the average looping time τ measured using single DNA cyclization assay for the 73 bp left or right halves (LH and RH, respectively). (E and F) Averaged stretching time traces of FRET efficiency versus force for nucleosomes in ED1 and ED2 labeling schemes. Error bars denote SEM of 25 traces for 601 ED1, 15 traces for 601 ED2, 29 traces for 601MF ED1, 19 traces for 601MF ED2. (G and H) Illustrations of the relationship between the direction of nucleosome unwrapping and the DNA flexibility of the two halves of the nucleosomal DNA sequence. The nucleosome unwraps from the stiffer side (single-headed arrows) if the DNA flexibility differs significantly between the two sides. See also Figure S5.
Figure 6
Figure 6. Stochastic Unwrapping of Nucleosome on the Sequence with Similar Flexibility on Two Sides
(A) Scheme of the 601RTA sequence which is derived from the 601 sequence by substitution of three dinucleotides on the right side by three TA steps. (B) Nucleosomal DNA structures are shown in the same color scheme with the scheme of the sequence. (C) Single exponential fits to the looped DNA fraction versus time yield the average looping time τ measured using single DNA cyclization assay for the 73 bp left or right halves (LH and RH, respectively) for the 601RTA sequence. (D) Averaged stretching time traces of FRET efficiency versus force for nucleosomes in ED1 (average of 57 traces) and ED2 (average of 7 traces) labeling schemes for the 601 RTA sequence. Error bars denote SEM. (E) A cartoon illustrating stochastic unwrapping of nucleosome from either side when the DNA flexibility on the two sides is made similar on the 601RTA sequence. (F) Representative single-molecule fluorescence-force time trace for 601-RTA nucleosome reconstituted with the ED1 labeling scheme. Two unwrapping paths are shown. Path 1 is gradual FRET decrease at low force (similar to original weak side), while path 2 is sudden FRET decrease at high force (similar to original strong side). (G and H) Averaged FRET versus force stretching curves for 601-RTA-ED1 (25 traces for path 1 and 32 traces for path 2) nucleosomes (G) and 601-RTA-ED2 (four traces for path 1 and three traces for path 2) nucleosomes (H), comparing to that of ED1 and ED2 of the 601 sequence. Representative single-molecule stretching traces are shown in lighter color lines. See also Figure S6.
Figure 7
Figure 7. Monte Carlo Simulation of Nucleosome Unwrapping
(A–D) Representative Monte Carlo simulation records show the number of base pairs unwrapped from the weak side (blue) and the strong side (red) as the force increased from 0.1 pN to 10 pN. (E) A 2D representation of unwrapping trajectory shown in (B). Different portions of the trajectory at difference forces are shown in different colors as indicated.

Comment in

Similar articles

Cited by

References

    1. Andrews AJ, Luger K. Nucleosome Structure(s) and Stability: Variations on a Theme. In: Rees DC, Dill KA, Williamson JR, editors. Annual Review of Biophysics. Vol. 40. 2011. pp. 99–117. - PubMed
    1. Bintu L, Kopaczynska M, Hodges C, Lubkowska L, Kashlev M, Bustamante C. The elongation rate of RNA polymerase determines the fate of transcribed nucleosomes. Nature Structural & Molecular Biology. 2011;18:1394–1399. - PMC - PubMed
    1. Bintu L, Ishibashi T, Dangkulwanich M, Wu YY, Lubkowska L, Kashlev M, Bustamante C. Nucleosomal Elements that Control the Topography of the Barrier to Transcription. Cell. 2012;151:738–749. - PMC - PubMed
    1. Böhm V, Hieb AR, Andrews AJ, Gansen A, Rocker A, Tóth K, Luger K, Langowski J. Nucleosome accessibility governed by the dimer/tetramer interface. Nucleic Acids Res. 2011;39:3093–3102. - PMC - PubMed
    1. Bondarenko VA, Steele LM, Ujvari A, Gaykalova DA, Kulaeva OI, Polikanov YS, Luse DS, Studitsky VM. Nucleosomes can form a polar barrier to transcript elongation by RNA polymerase II. Molecular Cell. 2006;24:469–479. - PubMed

Publication types