Comparative Study
. 2015 Mar 13;9(3):e0003566.
doi: 10.1371/journal.pntd.0003566. eCollection 2015 Mar.

Comparative analysis of field-isolate and monkey-adapted Plasmodium vivax genomes

Affiliations
Comparative Study

Comparative analysis of field-isolate and monkey-adapted Plasmodium vivax genomes

Ernest R Chan et al. PLoS Negl Trop Dis. .

Abstract

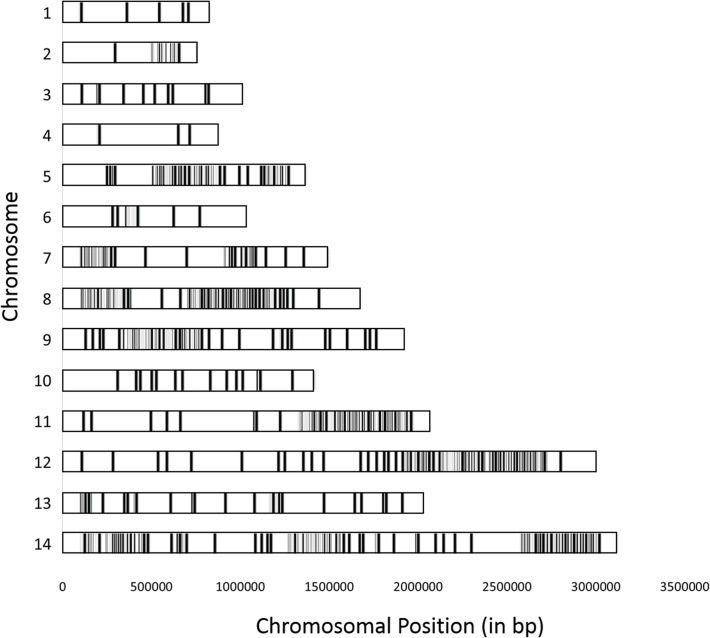
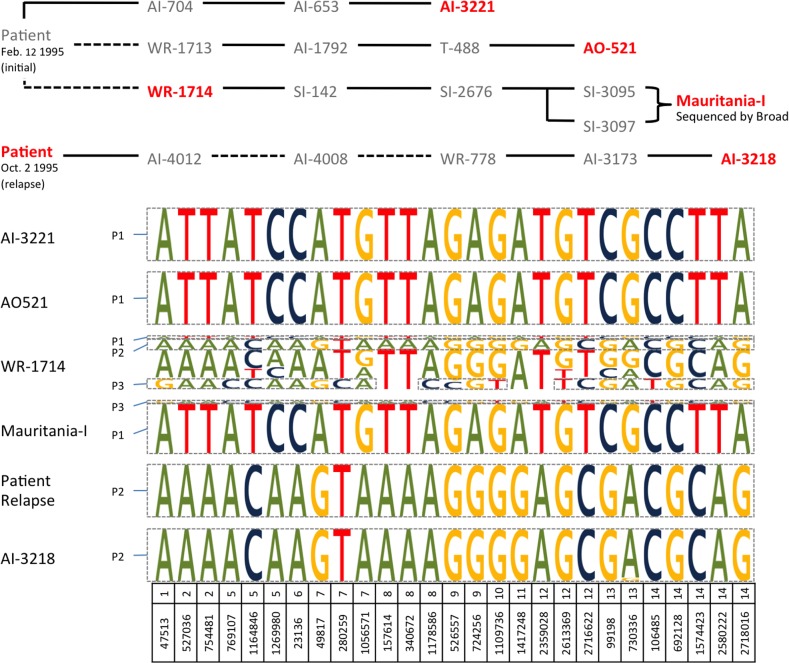
Significant insights into the biology of Plasmodium vivax have been gained from the ability to successfully adapt human infections to non-human primates. P. vivax strains grown in monkeys serve as a renewable source of parasites for in vitro and ex vivo experimental studies and functional assays, or for studying in vivo the relapse characteristics, mosquito species compatibilities, drug susceptibility profiles or immune responses towards potential vaccine candidates. Despite the importance of these studies, little is known as to how adaptation to a different host species may influence the genome of P. vivax. In addition, it is unclear whether these monkey-adapted strains consist of a single clonal population of parasites or if they retain the multiclonal complexity commonly observed in field isolates. Here we compare the genome sequences of seven P. vivax strains adapted to New World monkeys with those of six human clinical isolates collected directly in the field. We show that the adaptation of P. vivax parasites to monkey hosts, and their subsequent propagation, did not result in significant modifications of their genome sequence and that these monkey-adapted strains recapitulate the genomic diversity of field isolates. Our analyses also reveal that these strains are not always genetically homogeneous and should be analyzed cautiously. Overall, our study provides a framework to better leverage this important research material and fully utilize this resource for improving our understanding of P. vivax biology.


Conflict of interest statement

The authors have declared that no competing interests exist.

Figures

Fig 1
Fig 1. Genomic relationships among P. vivax isolates.
Principal component analysis based on 81,328 SNVs in four field isolates (C127, C08, M08 and M15) and seven monkey-adapted strains (Salvador-I, Brazil-I, Belem, Chesson, North Korea, India-VII and Mauritania-I) for which an entire haploid genome sequence could be reconstructed. The sample names are colored by their geographic origin: blue for Central and South America, green for Asia and red for Africa.
Fig 2
Fig 2. Shared telomeric deletion.
The figure shows a ~120 kb deletion indicated by the decrease in sequence coverage (y-axis, in reads per bp) at the telomeric end of chromosome 7 (x-axis in 1,000 bp). The sequence coverage is displayed, from top to bottom, for three monkey-adapted strains (Belem, Brazil-I and North Korea) and one Cambodian field isolate (C15). The bottom track shows the variation in GC content along this region. The lower coverage in North Korea and C15 indicates that only some of the parasites carry the deletion. Note also that the deletion boundary is different in different samples.
Fig 3
Fig 3. Distribution of the Reference Allele Frequency (RAF) in monkey-adapted strains sequenced to date.
The graph shows the number of variable positions (y-axis) in a given sample according to the proportion of reads carrying the reference (i.e., Salvador I) allele (x-axis, in %). For most monkey-adapted strains the distribution is U shaped consistent with the present of a single haploid clone. However, the RAF distributions for Mauritania-I (in dotted red) and Chesson (in dotted green) indicate the presence of a second clone. The RAF for the human isolates mentioned in the manuscript is presented in S1 Fig.
Fig 4
Fig 4. Relationships among different monkey-adapted strains.
The figure shows a neighbor-joining tree based on the number of nucleotide differences between samples using all variable positions throughout the genome. Note that the DNA sequences of the two clones identified in the Mauritania strain are much more closely related (i.e., shorter branch lengths) than any other two sequences.
Fig 5
Fig 5. Genomic distribution of the nucleotide differences between the clones present in the Mauritania-I sample.
Each grey bar represents one single nucleotide difference between the two clones detected in the Mauritania-I genome sequence data and is displayed according to its position (x-axis, in bp) along one of the P. vivax chromosome (from chromosome 1 on top to chromosome 14 at the bottom). Note that 1,969 out of the 2,255 nucleotides differences (87%) between the two clones were clustered in 153 regions accounting for 3.78 Mb (or 20% of the genome).
Fig 6
Fig 6. Complexity of infection in the Mauritania-I and Mauritania-II samples.
The top panel shows the passage history of the Mauritania-I (starting with the initial patient infection of February 12, 1995) and Mauritania-II (starting with the October 2 relapse) strains (adapted from Collins et al., 1998). The six samples analyzed in this study are indicated in red. Solid black lines represent infections propagated in either Aotus nancymaae (AI, AO and WR) or Saimiri boliviensis boliviensis (SI) monkeys through injections of infected erythrocytes. Dashed lines represent passage through mosquitoes and propagation by sporozoites. The lower panel shows genotypes of the different clones present in each of the Mauritania samples analyzed (all samples are monkey-adapted strains but the “Patient Relapse” which is a clinical sample). The height of each allele represents its relative frequency in each sample and the alleles are organized based on the haplotypes inferred for each clone. Note that the allele frequencies in WR-1714 likely indicate the presence of one or more supplementary clones in addition to P1, P2 and P3.

References

    1. Gething PW, Elyazar IR, Moyes CL, Smith DL, Battle KE, et al. (2012) A long neglected world malaria map: Plasmodium vivax endemicity in 2010. PLoS Negl Trop Dis 6: e1814 10.1371/journal.pntd.0001814 - DOI - PMC - PubMed
    1. Cotter C, Sturrock HJ, Hsiang MS, Liu J, Phillips AA, et al. (2013) The changing epidemiology of malaria elimination: new strategies for new challenges. Lancet 382: 900–911. 10.1016/S0140-6736(13)60310-4 - DOI - PMC - PubMed
    1. Neafsey DE, Galinsky K, Jiang RHY, Young L, Sykes SM, et al. (2012) The malaria parasite Plasmodium vivax exhibits greater genetic diversity than Plasmodium falciparum. Nature Publishing Group 44: 1046–1050. - PMC - PubMed
    1. Dharia NV, Bright aT, Westenberger SJ, Barnes SW, Batalov S, et al. (2010) Whole-genome sequencing and microarray analysis of ex vivo Plasmodium vivax reveal selective pressure on putative drug resistance genes. Proceedings of the National Academy of Sciences of the United States of America 107: 20045–20050. 10.1073/pnas.1003776107 - DOI - PMC - PubMed
    1. Chan ER, Menard D, David PH, Ratsimbasoa A, Kim S, et al. (2012) Whole genome sequencing of field isolates provides robust characterization of genetic diversity in Plasmodium vivax. PLoS neglected tropical diseases 6: e1811 10.1371/journal.pntd.0001811 - DOI - PMC - PubMed

Publication types

LinkOut - more resources