

Differential intensity-dependent effects of magnetic stimulation on the longest neurites and shorter dendrites in neuroscreen-1 cells
- PMID: 25769013
- PMCID: PMC4400261
- DOI: 10.1088/1741-2560/12/2/026013
Differential intensity-dependent effects of magnetic stimulation on the longest neurites and shorter dendrites in neuroscreen-1 cells
Abstract
Objective: Magnetic stimulation (MS) is a potential treatment for neuropsychiatric disorders. This study investigates whether MS-regulated neuronal activity can translate to specific changes in neuronal arborization and thus regulate synaptic activity and function.
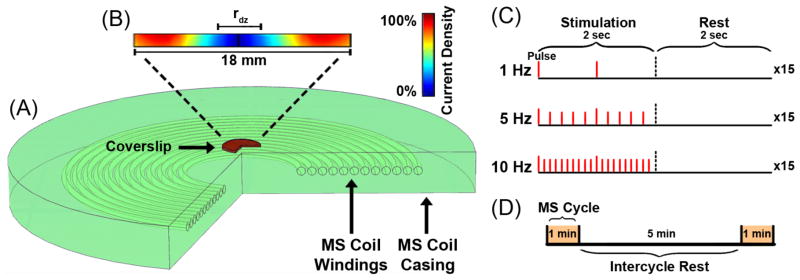
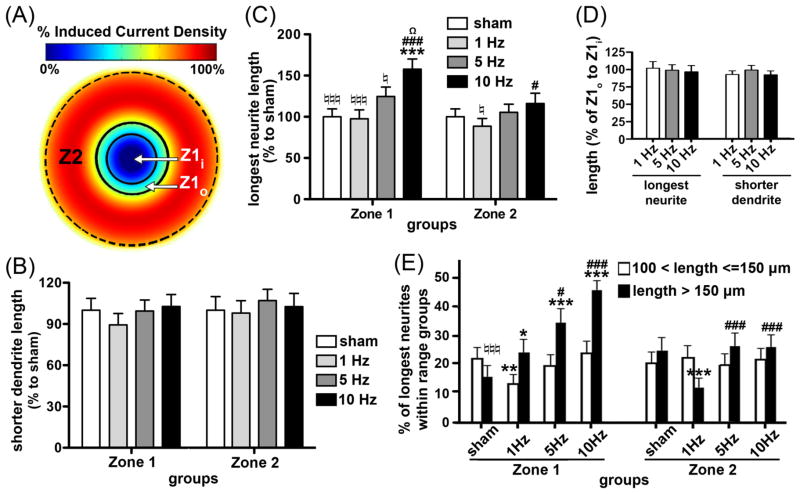
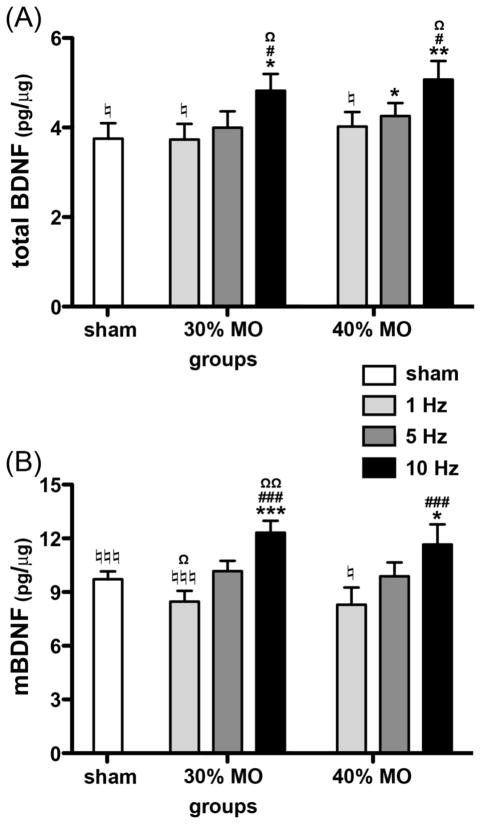
Approach: To test our hypotheses, we examined the effects of MS on neurite growth of neuroscreen-1 (NS-1) cells over the pulse frequencies of 1, 5 and 10 Hz at field intensities controlled via machine output (MO). Cells were treated with either 30% or 40% MO. Due to the nature of circular MS coils, the center region of the gridded coverslip (zone 1) received minimal (∼5%) electromagnetic current density while the remaining area (zone 2) received maximal (∼95%) current density. Plated NS-1 cells were exposed to MS twice per day for three days and then evaluated for length and number of neurites and expression of brain-derived neurotrophic factor (BDNF).
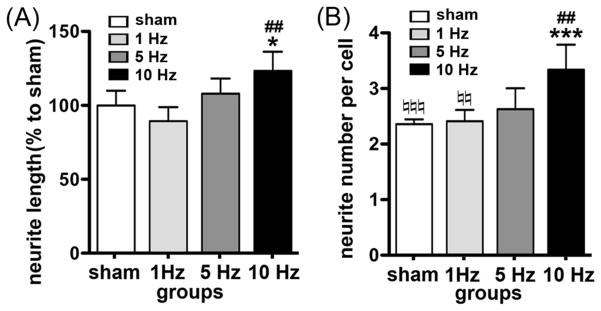
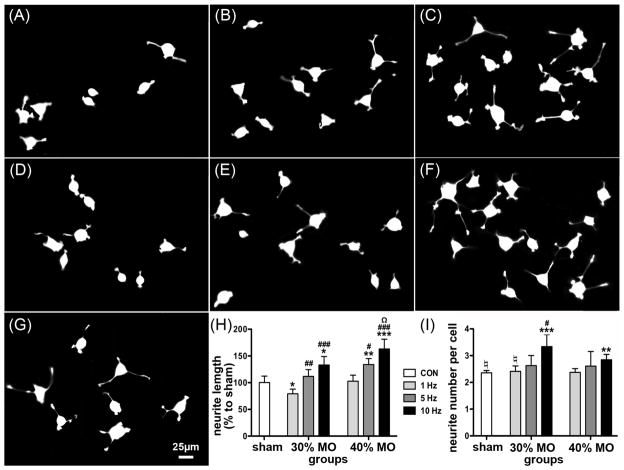
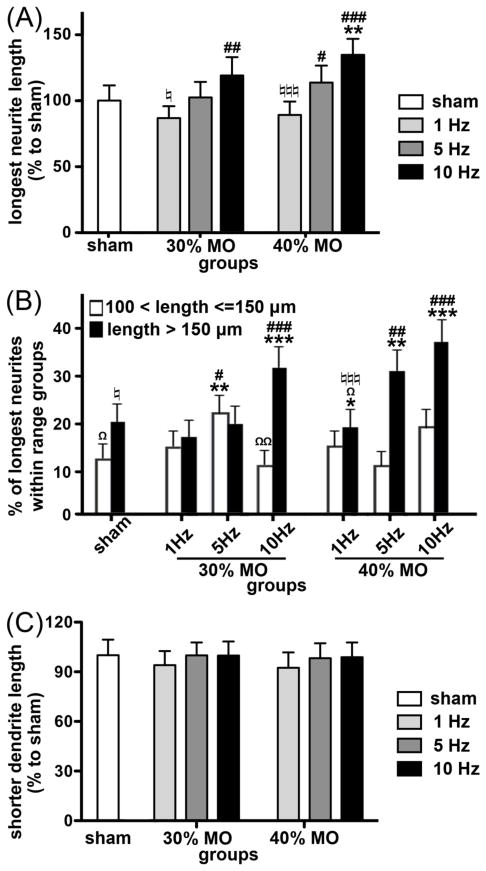
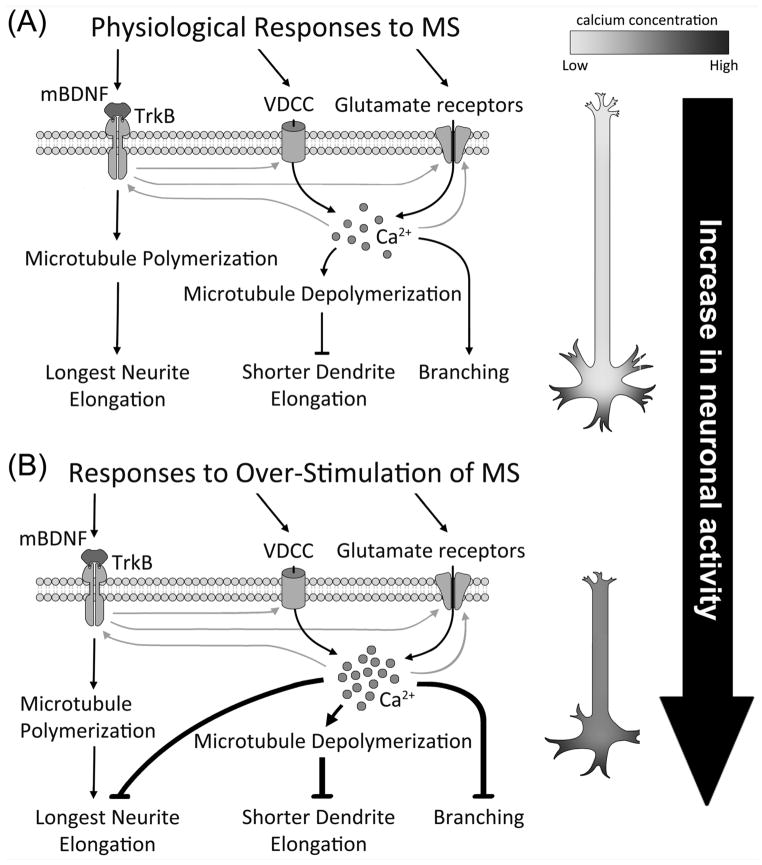
Main results: We show that MS dramatically affects the growth of the longest neurites (axon-like) but does not significantly affect the growth of shorter neurites (dendrite-like). Also, MS-induced changes in the longest neurite growth were most evident in zone 1, but not in zone 2. MS effects were intensity-dependent and were most evident in bolstering longest neurite outgrowth, best seen in the 10 Hz MS group. Furthermore, we found that MS-increased BDNF expression and secretion was also frequency-dependent. Taken together, our results show that MS exerts distinct effects when different frequencies and intensities are applied to the neuritic compartments (longest neurite versus shorter dendrite(s)) of NS-1 cells.
Significance: These findings support the concept that MS increases BDNF expression and signaling, which sculpts longest neurite arborization and connectivity by which neuronal activity is regulated. Understanding the mechanisms underlying MS is crucial for efficiently incorporating its use into potential therapeutic strategies.
Figures
Similar articles
-
Influence of pulsed electromagnetic field with different pulse duty cycles on neurite outgrowth in PC12 rat pheochromocytoma cells.Bioelectromagnetics. 2005 Jul;26(5):406-11. doi: 10.1002/bem.20116. Bioelectromagnetics. 2005. PMID: 15887254
-
Ultrasound can modulate neuronal development: impact on neurite growth and cell body morphology.Ultrasound Med Biol. 2013 May;39(5):915-25. doi: 10.1016/j.ultrasmedbio.2012.12.003. Epub 2013 Feb 13. Ultrasound Med Biol. 2013. PMID: 23415289
-
Neuronal outgrowth of PC-12 cells after combined treatment with nerve growth factor and a magnetic field: influence of the induced electric field strength.Bioelectromagnetics. 2005 Jan;26(1):74-7. doi: 10.1002/bem.20073. Bioelectromagnetics. 2005. PMID: 15605400
-
Stimulation of neurite outgrowth on neonatal cerebral astrocytes is enhanced in the presence of BDNF.Neurosci Lett. 2006 Oct 30;407(3):268-73. doi: 10.1016/j.neulet.2006.08.059. Epub 2006 Sep 15. Neurosci Lett. 2006. PMID: 16978777
-
Molecular mechanisms regulating the spatial configuration of neurites.Semin Cell Dev Biol. 2022 Sep;129:103-114. doi: 10.1016/j.semcdb.2022.02.015. Epub 2022 Mar 2. Semin Cell Dev Biol. 2022. PMID: 35248463 Review.
Cited by
-
A DEHP plasticizer alters synaptic proteins via peroxidation.Toxicol Res (Camb). 2016 Nov 2;6(1):89-97. doi: 10.1039/c6tx00361c. eCollection 2017 Jan 1. Toxicol Res (Camb). 2016. PMID: 30090480 Free PMC article.
-
Assessing the combination of magnetic field stimulation, iron oxide nanoparticles, and aligned electrospun fibers for promoting neurite outgrowth from dorsal root ganglia in vitro.Acta Biomater. 2021 Sep 1;131:302-313. doi: 10.1016/j.actbio.2021.06.049. Epub 2021 Jul 13. Acta Biomater. 2021. PMID: 34271170 Free PMC article.
References
-
- Ahlijanian MK, Westenbroek RE, Catterall WA. Subunit structure and localization of dihydropyridine-sensitive calcium channels in mammalian brain, spinal cord, and retina. Neuron. 1990;4:819–832. - PubMed
-
- Atwal JK, Massie B, Miller FD, Kaplan DR. The TrkB-Shc site signals neuronal survival and local axon growth via MEK and P13-kinase. Neuron. 2000;27:265–277. - PubMed
-
- Barker AT, Jalinous R, Freeston IL. Non-invasive magnetic stimulation of human motor cortex. Lancet. 1985;1:1106–1107. - PubMed
-
- Blackman CF, Benane SG, House DE. Evidence for direct effect of magnetic fields on neurite outgrowth. FASEB J. 1993;7:801–806. - PubMed
-
- Bramham CR, Messaoudi E. BDNF function in adult synaptic plasticity: the synaptic consolidation hypothesis. Prog Neurobiol. 2005;76:99–125. - PubMed
Publication types
MeSH terms
Grants and funding
LinkOut - more resources
Full Text Sources
Other Literature Sources
Miscellaneous