. 2015 Mar;27(3):485-512.
doi: 10.1105/tpc.114.132266. Epub 2015 Mar 13.

Identification and mode of inheritance of quantitative trait loci for secondary metabolite abundance in tomato

Affiliations

Identification and mode of inheritance of quantitative trait loci for secondary metabolite abundance in tomato

Saleh Alseekh et al. Plant Cell. 2015 Mar.

Abstract

A large-scale metabolic quantitative trait loci (mQTL) analysis was performed on the well-characterized Solanum pennellii introgression lines to investigate the genomic regions associated with secondary metabolism in tomato fruit pericarp. In total, 679 mQTLs were detected across the 76 introgression lines. Heritability analyses revealed that mQTLs of secondary metabolism were less affected by environment than mQTLs of primary metabolism. Network analysis allowed us to assess the interconnectivity of primary and secondary metabolism as well as to compare and contrast their respective associations with morphological traits. Additionally, we applied a recently established real-time quantitative PCR platform to gain insight into transcriptional control mechanisms of a subset of the mQTLs, including those for hydroxycinnamates, acyl-sugar, naringenin chalcone, and a range of glycoalkaloids. Intriguingly, many of these compounds displayed a dominant-negative mode of inheritance, which is contrary to the conventional wisdom that secondary metabolite contents decreased on domestication. We additionally performed an exemplary evaluation of two candidate genes for glycolalkaloid mQTLs via the use of virus-induced gene silencing. The combined data of this study were compared with previous results on primary metabolism obtained from the same material and to other studies of natural variance of secondary metabolism.


Figures

Figure 1.
Figure 1.
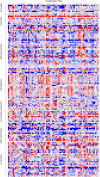
Overlay Heat Map of the Metabolite Profiles of Two Independent Studies of the Pericarp Metabolite Content of the ILs Compared with the Parental Control (M82). Data represent measurements of material harvested in field trials performed in 2001 and 2004 and are presented as a heat map. Large sections of the map are white or pale in color, reflecting that many of the chromosomal segment substitutions do not have an effect on the amount of every metabolite. Regions of red or blue indicate that the metabolite content increased or decreased, respectively, after introgression of S. pennellii segments. Very dark coloring indicates that a large change in metabolite content was conserved across both harvests, whereas purple indicates an inconsistent change in that IL relative to M82. For each harvest, UPLC-FTMS was used to quantify 145 metabolites, including flavanols, hydroxycinnamate derivatives, glycoalkaloids, and acyl-sugars. Due to space constraints, this heat map is not annotated; however, fully annotated heat maps for the individual data sets are provided in Supplemental Figures 1 to 3. The introgression lines are presented in chromosomal order from top of chromosome 1 to base of chromosome 12 from left to right.
Figure 2.
Figure 2.
Distributions of Log-Fold Changes. Box plots of the log-fold changes of all primary and secondary metabolites, measured with GC-MS and LC-MS technologies, respectively, from the considered ILs with respect to M82 are shown. Note that the median of the log-fold changes of secondary metabolites is smaller than that of the primary metabolites. (A) Data from 2001 field trail. (B) Data from 2004 field trail. (C) Data from both field trails combined.
Figure 3.
Figure 3.
Metabolic Hot Spots. Chromosome mapping of (P ≤ 0.01) QTLs location based on a genetic map of S. pennellii introgression lines (http://www.sgn.cornell.edu); circles next to the genome segment indicate the positions and are proportional to the number of QTLs for each compound class. The circle color is presented in the order of flavonoids, hydroxycinnamates, glycoalkaloids, N-containing, other phenolic, and acyl-sugars from left to right.
Figure 4.
Figure 4.
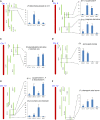
Schematic Representation of S. pennellii ILs for Four Chromosomes, Showing the Effect of Genomic Regions on the Levels of Secondary Metabolites. (A) Region on chromosome 1 (IL1-1) for dehydroesculeoside A or B. (B) Region on chromosome 6 (IL6-2 and IL6-2-2 for lycoperoside F [B-1] and IL6-3 and IL6-4 for pregnane derivative [B-2]). (C) Region on chromosome 7 (IL7-4 and IL7-4-1) for glycoalkaloids derivatives (1363.528 m/z). (D) Region on chromosome 8 (IL8-2 and IL8-2-1) for acylated hexoses. (E) Region on chromosome 10 (IL10-2 and IL10-3) for lycoperoside G and F or esculeoside A (IL10-3) for coumaric acid hexose. (F) Region on chromosome 12 (IL12-4 and IL12-4-1) for chlorogenic acid isomers. Data are shown as a fold changes compared with recurrent parent M82. All the QTLs are conserved in both harvests; all significance at P ≤ 0.01.
Figure 5.
Figure 5.
Heritability of Secondary Metabolite Traits in the S. pennellii Introgression Population. Environment (E) + E × genotype (G) effect of selected secondary metabolites using a mixed-effect model to combine the data from the two years (2004 and 2001).
Figure 6.
Figure 6.
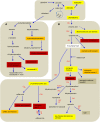
Metabolites That Display High, Moderate, and Low Hereditability as Assessed from 2 Years of Growth Trials. Data are taken from Figure 5 and displayed in a pathway-based manner: glycoalkaloids (A) and flavonoids (B). Metabolites marked in red were determined to be highly hereditable, those in yellow to display low hereditability, and those in orange to be intermediate. Heritability for metabolites marked in pale gray was not calculated. Values for shikinate and phenylalanine were taken from Schauer et al. (2008). Heritability is classified as high, intermediate, or low using thresholds of >0.4, between 0.2 and 0.4, and below 0.2, respectively.
Figure 7.
Figure 7.
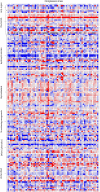
Heat Map of the Metabolite Profiles of M82 Lines Heterozygous (ILH) for the Chromosomal Segmental Substitution from S. pennellii. Results presented are pericarp metabolite content data obtained from the ILHs of the 2004 harvest. Regions of dark red or dark blue indicate that the metabolite content is increased or decreased, respectively, after introgression of S. pennellii segments. UPLC-FTMS was used to quantify 145 metabolites, including flavanols, hydroxycinnamate derivatives, glycoalkaloids, and acyl-sugars. Due to space constraints, this heat map is not annotated; however, a fully annotated heat map including the metabolite profiles of the ILHs from the 2004 harvest is provided in Supplemental Figure 2. The introgression lines are presented in chromosomal order from top of chromosome 1 to base of chromosome 12 from left to right
Figure 8.
Figure 8.
Distribution of the QTL Mode of Inheritance for Metabolite Accumulation. Each vertical bar represents the number of QTLs for a specific trait, colored according to mode-of-inheritance categories: additive, dominant, and recessive. The bars above the 0 line represent the number of increasing QTLs, whereas the negative bars represent the number of decreasing QTLs relative to M82. A fully annotated figure with the exact compound ID is provided in Supplemental Figure 5 and Supplemental Data Set 7.
Figure 9.
Figure 9.
Correlation Networks for the LC-MS Data Assessed in This Study. The network comprises nodes representing primary metabolites, secondary metabolites, and phenotypic traits, denoted by the following colors: N-containing compounds (brown), hydroxycinnamate derivatives (blue), acyl-sugars (red), glycoalkaloids (orange), flavonoids (green), polyamines (coral), amino acids (yellow), organic acids (pink), sugars (white), and all other metabolites without compound class (gray). Homozygous lines ([A] and [B]) from 2001 and 2004, respectively, and heterozygous introgression lines from 2004 (C), denoted by HO1, HO4, and HE4 networks. The networks are sparsified by removing 30% of the edges at random for easy visualization, while maintaining the relative ordering of nodes based on their degrees in the original network. (D) shows a scatterplot and linear fit between absolute value of the difference in node degrees of HO1, HO4, and the heritability of the respective metabolites.
Figure 10.
Figure 10.
Combined Correlation Networks for the LC-MS Data and Phenotypic Traits. The network comprises nodes representing primary metabolites, secondary metabolites, and phenotypic traits, denoted by the following colors: N-containing compounds (brown), hydroxycinnamate derivatives (blue), acyl-sugars (red), glycoalkaloids (orange), flavonoids (green), polyamines (coral), amino acids (yellow), organic acids (pink), sugars (white), all other metabolites without compound class (gray), and composite traits (black) from homozygous (A) and heterozygous (B) introgression lines from 2004, denoted by HO and HE networks. The networks are sparsified by removing 30% of the edges at random for easy visualization, while maintaining the relative ordering of nodes based on their degrees in the original network.
Figure 11.
Figure 11.
TF Profiles of Tomato Fruits of Selected ILs. Heat map showing the fold changes of 974 TFs relative to recurrent parent (M82) in 2001 (three biological replicates were measured). TFs grouped based on the TF families and sorted according to average of fold change within the same group (full data set available in Supplemental Data Set 8).
Figure 12.
Figure 12.
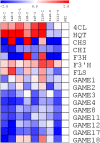
Heat Map Showing the Relative Gene Expression of Phenylpropanoid, Flavonoid, and Glycoalkaloid Genes. Expression levels were measured by qRT-PCR. 4CL, 4-coumarate-CoA ligase; HQT, hydroxycinnamoyl CoA quinate transferase; CHS1, chalcone synthase; CHI, chalcone isomerase; F3H, flavanone-3-hydroxylase; F3′H, flavonoid-3′-hydroxylase; FLS, flavonol synthase; GAME, glycoalkaloid metabolism genes (GAME1, 2, and 3 [Itkin et al., 2011] and GAME4, 8, 11, 12, 17, and 18 [Itkin et al., 2013]). Values are average of three biological replicates and represent as log2 fold changes compared with M82.
Figure 13.
Figure 13.
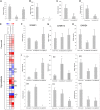
Gene Expression and Metabolite Changes in IL6-2, IL6-2, IL10-2, IL10-3, Solyc06g062290, and Solyc10g085230 Transiently Silenced Tomato Fruits. (A) Relative levels of mRNA in M82, IL6-2, and IL6-3. (B) Relative levels of mRNA in M82, IL10-2, and IL10-3. (C) and (D) Relative levels of mRNA in control (empty vector) and silenced fruit of Solyc06g062290 (C) and Solyc10g085230 (D) harvested from VIGS agroinfiltrated tomato plants. (E) Heat map of secondary metabolite changes in the control (empty vector) and silenced fruit of Solyc06g062290 and Solyc10g085230 harvested from VIGS agroinfiltrated tomato plants. (F) to (H) Relative levels of mRNA in GAME1 (F), GAME12 (G), and GAME 4 (H) (GAME1; Itkin et al., 2011; GAME4 and 12; Itkin et al., 2013). (I) Changes in major glycoalkaloids in control (empty vector) and silenced fruit of Solyc06g062290 and Solyc10g085230 (i), α-tomatin (ii), lycoperoside G/F (iii), esculeoside A + hexose (iv), dehydrolycoperoside G/F or dehydroesculeoside A (v), and unknown glycoalkaloids (vi) (m/z = 1341.1 and 1122.6). Data are mean ± se; asterisks indicate a significant difference at P ≤ 0.05.

References

    1. Adato A., et al. (2009). Fruit-surface flavonoid accumulation in tomato is controlled by a SlMYB12-regulated transcriptional network. PLoS Genet. 5: e1000777. - PMC - PubMed
    1. Arvidsson S., Kwasniewski M., Riano-Pachon D.M., Mueller-Roeber B. (2008). QuantPrime – a flexible tool for reliable high-throughput primer design for quantitative PCR. BMC Bioinformatics 9: 15. - PMC - PubMed
    1. Ashikari M., Sakakibara H., Lin S., Yamamoto T., Takashi T., Nishimura A., Angeles E.R., Qian Q., Kitano H., Matsuoka M. (2005). Cytokinin oxidase regulates rice grain production. Science 309: 741–745. - PubMed
    1. Bagheri H., El-Soda M., van Oorschot I., Hanhart C., Bonnema G., Jansen-van den Bosch T., Mank R., Keurentjes J.J.B., Meng L., Wu J., Koornneef M., Aarts M.G.M. (2012). Genetic analysis of morphological traits in a new, versatile, rapid-cycling Brassica rapa recombinant inbred line population. Front. Plant Sci. 3: 183. - PMC - PubMed
    1. Bates, D., Maechler, M., Bolker, B., Walker, S. (2014). lme4: Linear mixed-effects models using Eigen and S4. R package version 1.1-7, http://CRAN.R-project.org/package=lme4.

Publication types

MeSH terms