. 2015 Mar 31;112(13):4092-7.
doi: 10.1073/pnas.1421437112. Epub 2015 Mar 13.

Community participation in biofilm matrix assembly and function

Affiliations

Community participation in biofilm matrix assembly and function

Kaitlin F Mitchell et al. Proc Natl Acad Sci U S A. .

Abstract

Biofilms of the fungus Candida albicans produce extracellular matrix that confers such properties as adherence and drug resistance. Our prior studies indicate that the matrix is complex, with major polysaccharide constituents being α-mannan, β-1,6 glucan, and β-1,3 glucan. Here we implement genetic, biochemical, and pharmacological approaches to unravel the contributions of these three constituents to matrix structure and function. Interference with synthesis or export of any one polysaccharide constituent altered matrix concentrations of each of the other polysaccharides. Each of these was also required for matrix function, as assessed by assays for sequestration of the antifungal drug fluconazole. These results indicate that matrix biogenesis entails coordinated delivery of the individual matrix polysaccharides. To understand whether coordination occurs at the cellular level or the community level, we asked whether matrix-defective mutant strains could be coaxed to produce functional matrix through biofilm coculture. We observed that mixed biofilms inoculated with mutants containing a disruption in each polysaccharide pathway had restored mature matrix structure, composition, and biofilm drug resistance. Our results argue that functional matrix biogenesis is coordinated extracellularly and thus reflects the cooperative actions of the biofilm community.

Keywords: Candida; biofilm; matrix; polysaccharide; resistance.


Conflict of interest statement

The authors declare no conflict of interest.

Figures

Fig. 1.
Fig. 1.
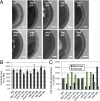
Extracellular matrix polysaccharides interact and are required for matrix structure. (A) Biofilm morphology and extracellular matrix abundance of mutant strains and the reference strain SN250 (Ref) was assessed visually using SEM imaging. White arrow indicates extracellular matrix material. (Scale bars, 20 μm.) (B) Carbohydrates in the extracellular matrix of biofilms were quantified using gas chromatography analysis for mannan or ELISA with monoclonal antibodies for β-1,6 glucan and β-1,3 glucan. Data are presented as percentages of the reference strain with SEs shown. All values were significantly lower than the reference according to ANOVA (P < 0.008). (C) Carbohydrates in the matrix of WT biofilms treated with TM, BFA, and α-mannosidase (αMS) were quantified using ELISA. Data are presented as percentages of the reference strain, with mean and SEs shown. All values were significantly lower than the reference according to ANOVA, except the β-1,3 glucan concentration in α-MS–treated biofilms (P < 0.002). (D) Specific monoclonal antibodies for each matrix carbohydrate were conjugated to a CNBr-activated Sepharose 4B column. Purified extracellular matrix was run through each column, with each yielding one carbohydrate-positive fraction, which was analyzed using gas chromatography. The relative ratios of mannose to glucose were determined.
Fig. 2.
Fig. 2.
Carbohydrate alterations in mutant biofilm cell walls are distinct from the extracellular matrix. (A) Representative images of biofilm cell wall ultrastructure, visualized using TEM. (Scale bars, 0.2 μm.) (B) The area of the cell wall was measured using ImageJ software. Values were normalized by the area of the total cell and are shown as a percentage of the reference strain. The mean and SEs from 10 individual cells are shown. (C) Cell wall carbohydrate composition was determined using gas chromatography. The percentage of the total carbohydrates in each sample comprised of mannose and glucose is shown.
Fig. 3.
Fig. 3.
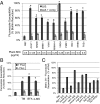
Interactions of extracellular matrix carbohydrates are required for biofilm antifungal resistance. (A) The percent of reduction in biofilm formation following 48-h treatment with 1,000 μg/mL fluconazole compared with untreated biofilms, as quantified using the 96-well XTT assay. The null mutant (Δ/Δ) and complemented strain (Δ/Δ + comp) are shown for each gene of interest. For FKS1, the TET-FKS1 strain is shown in place of a homozygous mutant, and the heterozygote strain is shown in place of a complemented strain. The minimum inhibitory concentration (MIC) of fluconazole for planktonic cells of the Δ/Δ strains is shown below. (B) Biofilms were treated with pharmacological inhibitors or enzymes both with and without 1,000 μg/mL fluconazole. Experiments used the same parameters as for the experiments in Fig. 1C, but in a 96-well plate format for quantification with the XTT assay. (C) Biofilms were grown for 48 h and then exposed to 3H-fluconazole. Extracellular matrix was isolated for scintillation counting, and the cpm for each mutant strain was compared with the reference strain. The figure represents the mean from three technical replicates. Asterisks indicate values were significantly different from the reference strain, based on ANOVA with pairwise comparisons using the Holm–Sidak method (P < 0.001). SEs are shown for all panels.
Fig. 4.
Fig. 4.
Mixed mutant biofilms have restoration of extracellular matrix structure and function. Different combinations of a mannan mutant (mnn9Δ/Δ), a β-1,6 glucan mutant (kre5Δ/Δ), and a β-1,3 glucan synthase mutant (TET-FKS1) were used in equal number to inoculate mixed biofilms. Assays were performed as previously described: (A) SEM, (B) matrix carbohydrate content (P < 0.05), (C) biofilm reduction following fluconazole treatment (P < 0.005), and (D) matrix fluconazole sequestration (P < 0.005). Data for single-mutant biofilms previously presented in Fig. 1 are shown here for reference. Asterisks indicate the mixed mutant biofilm values are significantly different from their corresponding single mutant values. (E) The mnn9Δ/Δ and kre5 Δ/Δ mixed biofilm was tested in vivo using a rat central venous catheter model, with the effects of fluconazole or saline treatment compared with the reference and single mutant biofilms. Biofilms were quantified using viable cell counts following treatment (P < 0.006). Statistical analyses are based on ANOVA using pairwise comparisons with the Holm–Sidak method. Mean and SEs are shown.

References

    1. Costerton JW, Stewart PS, Greenberg EP. Bacterial biofilms: A common cause of persistent infections. Science. 1999;284(5418):1318–1322. - PubMed
    1. Hall-Stoodley L, Stoodley P. Evolving concepts in biofilm infections. Cell Microbiol. 2009;11(7):1034–1043. - PubMed
    1. National Institutes of Health 1999. SBIR/STTR study and control of microbial biofilms. Available at grants.nih.gov/grants/guide/pa-files/PA-99-084.html. Accessed May 21, 2014.
    1. Chandra J, et al. Biofilm formation by the fungal pathogen Candida albicans: Development, architecture, and drug resistance. J Bacteriol. 2001;183(18):5385–5394. - PMC - PubMed
    1. Mah TF, O’Toole GA. Mechanisms of biofilm resistance to antimicrobial agents. Trends Microbiol. 2001;9(1):34–39. - PubMed

Publication types

LinkOut - more resources