. 2015 May;66(9):2795-811.
doi: 10.1093/jxb/erv095. Epub 2015 Mar 14.

The dual nature of trehalose in citrus canker disease: a virulence factor for Xanthomonas citri subsp. citri and a trigger for plant defence responses

Affiliations

The dual nature of trehalose in citrus canker disease: a virulence factor for Xanthomonas citri subsp. citri and a trigger for plant defence responses

Ainelén Piazza et al. J Exp Bot. 2015 May.

Abstract

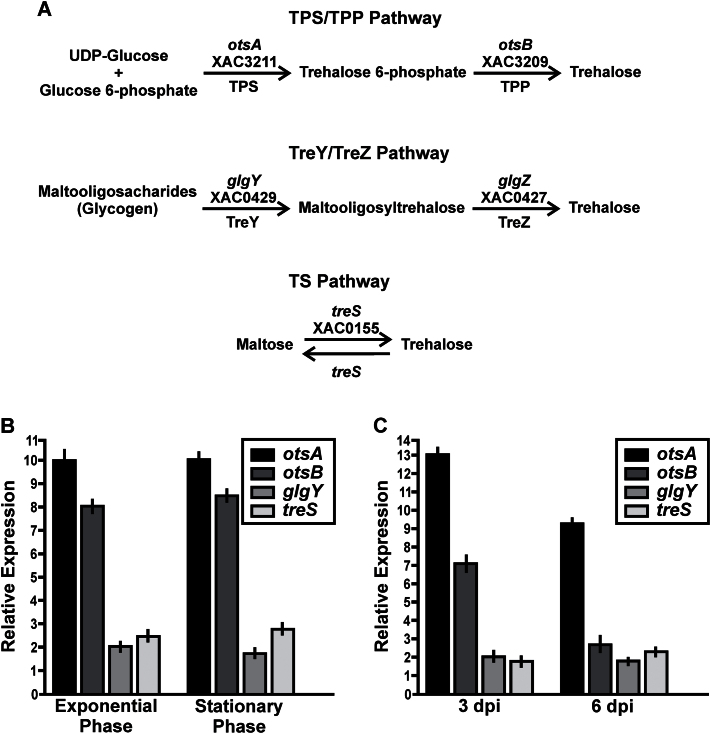
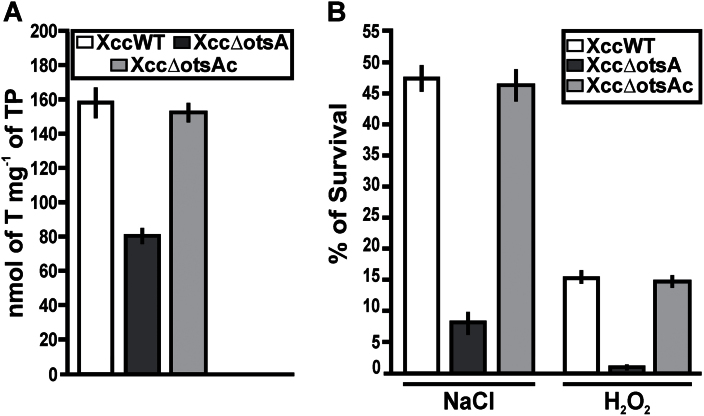
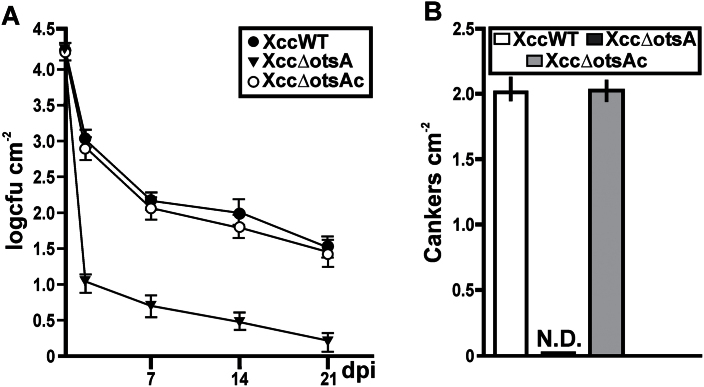
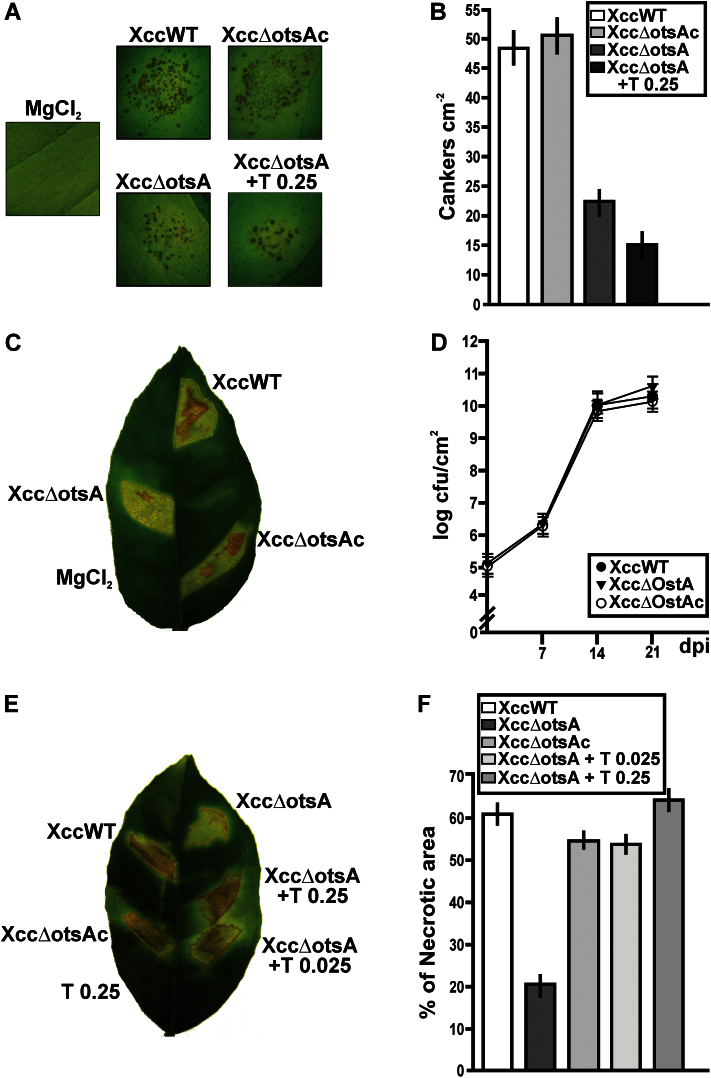
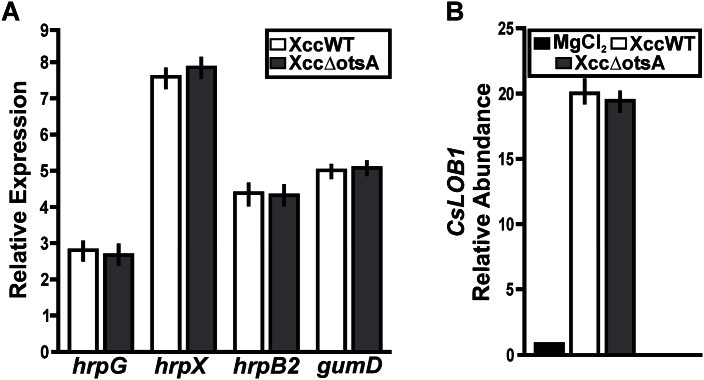
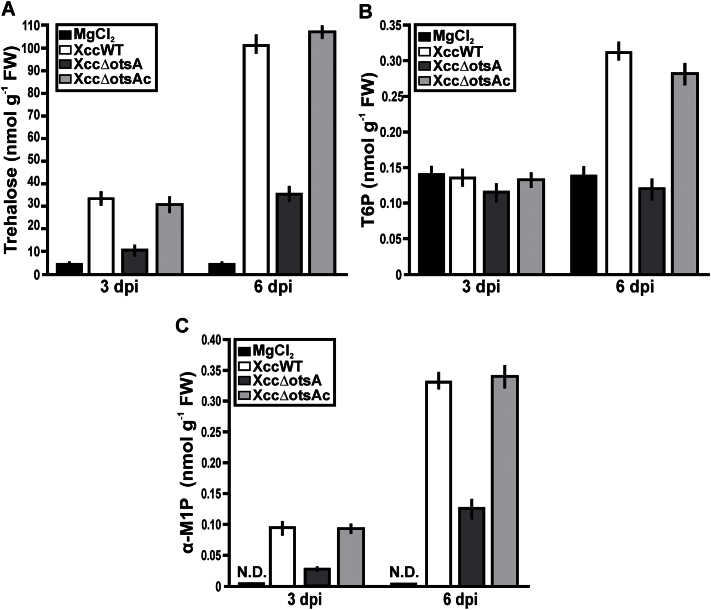
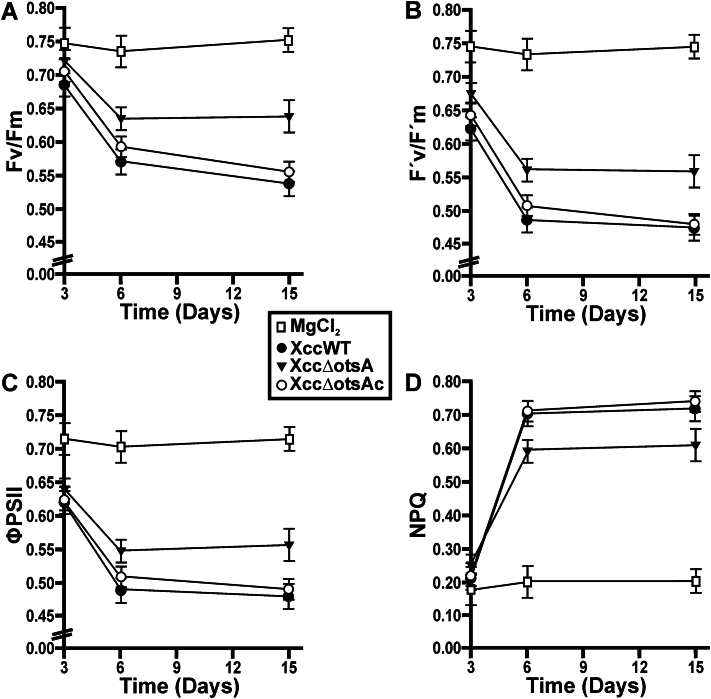
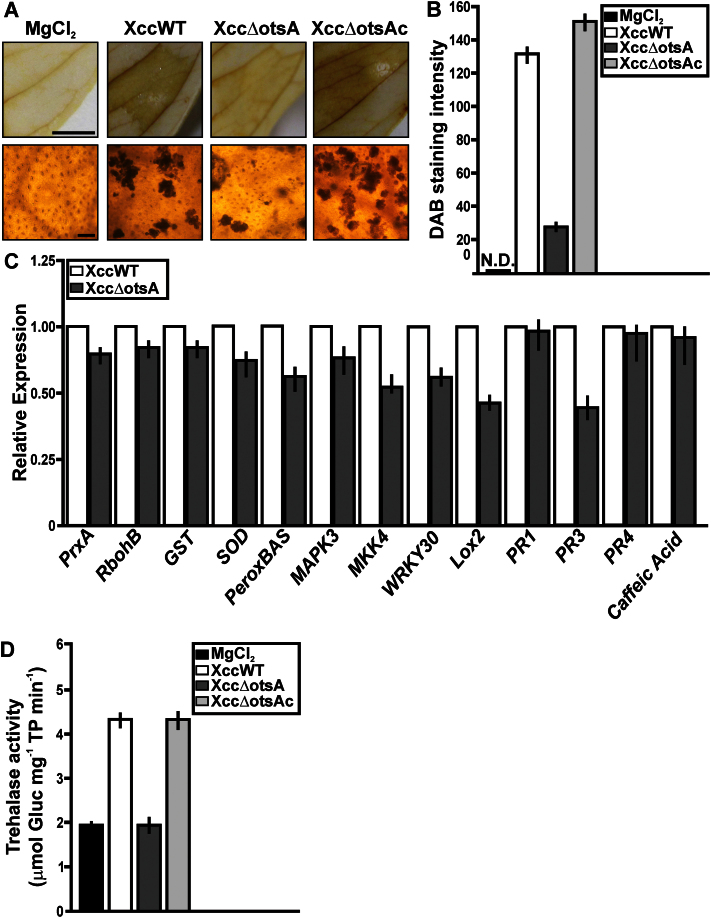
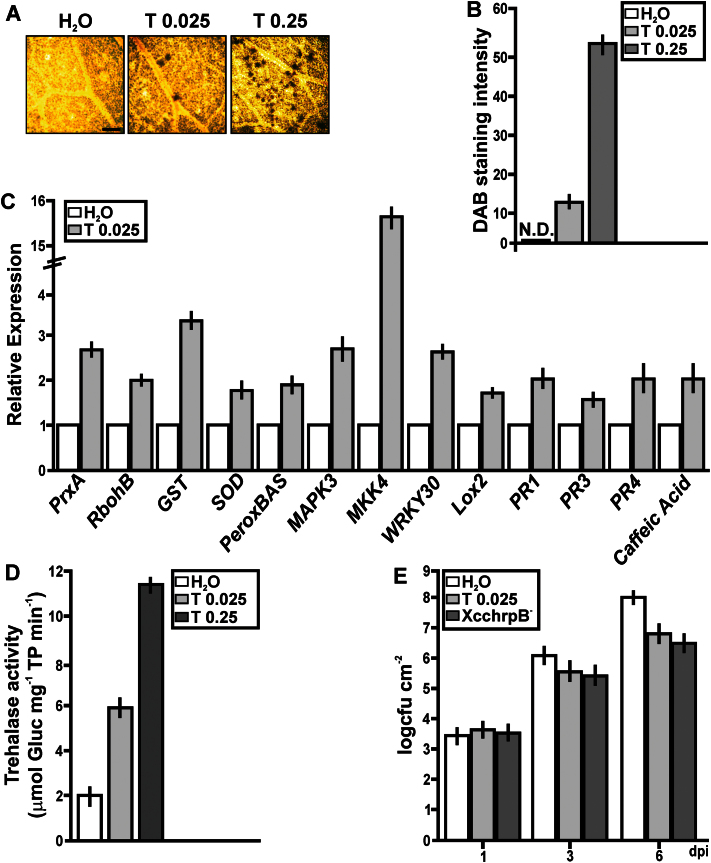
Xanthomonas citri subsp. citri (Xcc) is a bacterial pathogen that causes citrus canker in susceptible Citrus spp. The Xcc genome contains genes encoding enzymes from three separate pathways of trehalose biosynthesis. Expression of genes encoding trehalose-6-phosphate synthase (otsA) and trehalose phosphatase (otsB) was highly induced during canker development, suggesting that the two-step pathway of trehalose biosynthesis via trehalose-6-phosphate has a function in pathogenesis. This pathway was eliminated from the bacterium by deletion of the otsA gene. The resulting XccΔotsA mutant produced less trehalose than the wild-type strain, was less resistant to salt and oxidative stresses, and was less able to colonize plant tissues. Gene expression and proteomic analyses of infected leaves showed that infection with XccΔotsA triggered only weak defence responses in the plant compared with infection with Xcc, and had less impact on the host plant's metabolism than the wild-type strain. These results suggested that trehalose of bacterial origin, synthesized via the otsA-otsB pathway, in Xcc, plays a role in modifying the host plant's metabolism to its own advantage but is also perceived by the plant as a sign of pathogen attack. Thus, trehalose biosynthesis has both positive and negative consequences for Xcc. On the one hand, it enables this bacterial pathogen to survive in the inhospitable environment of the leaf surface before infection and exploit the host plant's resources after infection, but on the other hand, it is a tell-tale sign of the pathogen's presence that triggers the plant to defend itself against infection.

Keywords: Canker; Xanthomonas.; citrus; defence; otsA; trehalose.


Figures

Fig. 1.
Fig. 1.
Analysis of the expression levels of otsA, ostB, glgY, and TS in XccWT by RT-qPCR assays. (A) Representation of trehalose biosynthetic pathways found in Xcc. The annotations of the enzymes in the Xcc genome are shown above the arrows. (B) RT-qPCR of XccWT RNA extracted from exponential-phase and stationary-phase cultures grown in XVM2. Bars indicate the expression levels of the genes at both growth phases in XVM2 medium relative to the expression levels in NB rich medium. Values are the means of four biological replicates with three technical replicates each. Error bars indicate standard deviation. (C) RT-qPCR of XccWT RNA obtained from bacteria present in infected citrus leaves at 0, 3, and 6 dpi. Bars indicate the expression levels of the genes at 3 and 6 dpi relative to the expression levels at time 0. Values are the means of four biological replicates with three technical replicates each. Error bars indicate standard deviation. Results were analysed by Student t-test (P<0.05) and one-way ANOVA (P<0.05).
Fig. 2.
Fig. 2.
Quantification of trehalose and survival under salt and oxidative stress in the XccWT, Xcc∆otsA, and Xcc∆otsAc strains. (A) Trehalose content was quantified in the strains grown to the stationary phase in XVM2 medium. Bars indicate the nmol of trehalose (T) per mg of total protein (TP) of the bacterial pellets assayed. Values are the means of four cultures of each strain. Error bars indicate the standard deviation. (B) The cfu ml–1 of the strains in XVM2 medium without and in the presence of 300mM NaCl or 30mM H2O2 were calculated. Bars indicate the percentage survival under stress conditions relative to XVM2 medium. Values are the means of three independent experiments. Error bars indicate the standard deviation. The data were analysed for statistical differences by one-way ANOVA (P<0.05).
Fig. 3.
Fig. 3.
Analysis of the leaf-associated growth and the ability of canker formation of the XccWT, Xcc∆otsA, and Xcc∆otsAc strains using a natural method of infection. (A) Quantification of the population size of leaf-associated bacteria as log cfu cm–2 of citrus leaf surface on the indicated dpi. Values represent the mean of four leaves assayed for each strain. Error bars indicate the standard deviation. (B) Quantification of canker number on citrus leaves after 1 month of spray inoculation with the different strains at 109 cfu ml–1. N.D., not detected. The data were analysed for statistical differences by one-way ANOVA (P<0.05).
Fig. 4.
Fig. 4.
Analysis of the symptoms caused by XccWT, Xcc∆otsA, and Xcc∆otsAc in infiltrated citrus leaves. (A) The strains were inoculated at 103 cfu ml–1 into the intercellular spaces of fully expanded leaves. The Xcc∆otsA mutant was also co-infiltrated with 0.25mg ml–1 of trehalose. Representative leaves of each infection are shown at 15 dpi. (B) Quantification of cankers cm–2 of infiltrated tissues of the leaves infiltrated as in (A). Bars are the means of 15 citrus leaves infiltrated with each strain. Error bars show the standard deviation. (C) Strains were inoculated at 107 cfu ml–1 into the intercellular spaces of citrus leaves. A representative leaf is shown at 14 dpi. (D) Quantification of the population size of the strains inoculated in citrus leaves as described in (C). Values are the means of log cfu cm–2 of infiltrated tissues obtained from 15 infiltrated citrus leaves at different dpi. Error bars show the standard deviation. (E) A representative leaf of XccWT, Xcc∆otsAc, and Xcc∆otsA infections with co-infiltration of the Xcc∆otsA mutant with 0.025 and 0.25mg ml–1 of trehalose (T) at 14 dpi. (F) Quantification of the necrotic areas of the leaves infiltrated as in (C) and (E). Bars are the means of the percentages of necrotic areas for each strain from 15 infiltrated citrus leaves. Error bars show the standard deviation. The data were analysed for statistical differences by one-way ANOVA (P<0.05). (This figure is available in colour at JXB online.)
Fig. 5.
Fig. 5.
Analysis of Xcc∆otsA mutant virulence-related factors. (A) RT-qPCR of RNA obtained from XccWT and the Xcc∆otsA mutant present in infected citrus leaves at 0 and 3 dpi. Bars indicate the expression levels of the genes at 3 dpi relative to the expression levels at time 0. Values are the means of four biological replicates with three technical replicates each. Error bars show the standard deviation. (B) RT-qPCR to determine CsLOB1 expression levels in leaves at 3 dpi with XccWT and the Xcc∆otsA mutant strain. Bars indicate the expression levels relative to buffer infiltrations. Values are the means of four biological replicates with three technical replicates each. Error bars show the standard deviation. The data were analysed for statistical differences by one-way ANOVA (P<0.05).
Fig. 6.
Fig. 6.
Quantification of trehalose, T6P, and α-M1P in leaves infected with XccWT, Xcc∆otsA, and Xcc∆otsAc strains. The leaves were infiltrated with the strains at 107 cfu ml–1 and 10mM MgCl2, and after 3 and 6 dpi, quantification of trehalose (A), T6P (B), and α-M1P (C) as nmol g–1 of fresh weight (FW) of infiltrated tissue was performed. Bars are the means of the values of five infiltrated leaves with each strain at each time. Error bars show the standard error. N.D., not detected. Data were statically analysed by one-way ANOVA (P<0.05).
Fig. 7.
Fig. 7.
Photosynthetic parameters measurements in leaves infected with the XccWT, Xcc∆otsA, and Xcc∆otsAc strains. Quantification of the maximum quantum efficiency of PSII (Fv/Fm) (A), the effective quantum efficiency of PSII (F’v/F’m) (B), the PSII operating efficiency (ΦPSII) (C),and non-photochemical quenching (NPQ) (D) at different dpi in leaves infiltrated with the strains and with MgCl2 as a control. Values are the mean of five replicates and error bars represent the standard deviation. Data were statically analysed by one-way ANOVA (P<0.05).
Fig. 8.
Fig. 8.
Analysis of ROS production, RT-qPCR of citrus genes related to defence responses, and trehalase activity in citrus leaves infected with the XccWT, Xcc∆otsA, and Xcc∆otsAc strains. (A) DAB detection of H2O2 accumulation in citrus leaves infected with the strains at 3 dpi. Representative photographs of DAB stained leaves are shown in the upper panels and microscopic observations in the lower panels. Bars, 10mm (upper panel); 1mm (lower panel). (B) Quantification of DAB staining from the microscopic imagines. The means were calculated from 25 photographs from three independent experiments for each strain. Error bars indicate standard deviation. N.D., not detected. (C) RT-qPCR of citrus genes related to defence responses. Bars indicate the expression levels of the genes from RNA extracted from leaves infected with the different strains and MgCl2-infiltrated leaves at 1 dpi. Values are the means of four biological replicates with three technical replicates each. Error bars indicate standard deviation. (D) Quantification of trehalase activity [μmol of glucose (Gluc) mg–1 of total protein (TP) min–1] in leaves infiltrated with the strains at 3 dpi. Bars are the means of five infected leaves. Error bars indicate standard deviation. Results were analysed by Student’s t-test (P<0.05) and one-way ANOVA (P<0.05).(This figure is available in colour at JXB online.)
Fig. 9.
Fig. 9.
Analysis of ROS production, RT-qPCR of citrus genes related to defence responses, trehalase activity, and induction of the citrus response to XccWT in citrus leaves infiltrated with pure trehalose. (A) Representative microscopic photographs showing DAB staining of leaves infiltrated with 0.025 and 0.25mg ml–1 trehalose (T) and H2O as a control. Bar, 1mm. (B) Quantification of DAB staining from the microscopic images. Results are the means of 25 photographs from three independent experiments for each treatment. Error bars indicate standard deviation. N.D., not detected. (C) RT-qPCR of citrus genes related to defence responses. Results indicate the expression levels of the genes from RNA extracted from leaves infiltrated with 0.025mg ml–1 of trehalose at 1h post-infiltration relative to the expression levels found in H2O-infiltrated leaves. Values are the means of four biological replicates with three technical replicates each. Error bars indicate standard deviation. (D) Quantification of trehalase activity [μmol of glucose (Gluc) mg–1 of total protein (TP) min–1] in leaves infiltrated with 0.025 and 0.25mg ml–1 of trehalose or H2O as a control at 1h trehalose at 1h post-infiltration. Bars are the means of five infiltrated leaves. Error bars indicate standard deviation. (E) Quantification of XccWT growth in citrus leaves pre-infiltrated with 0.025mg ml–1 of trehalose, or with H2O or the XcchrpB strain as controls. Values are the means obtained from 10 infiltrated citrus leaves at different dpi. Error bars show the standard deviation. Results were analysed by Student’s t-test (P<0.05) and one-way ANOVA (P<0.05). (This figure is available in colour at JXB online.)

References

    1. Aghdasi M, Smeekensb S, Schluepmann H. 2008. Microarray analysis of gene expression patterns in Arabidopsis seedlings under trehalose, sucrose and sorbitol treatment. International Journal of Plant Production 2, 309–320.
    1. Ampomah OY, Jensen JB, Bhuvaneswari TV. 2008. Lack of trehalose catabolism in Sinorhizobium species increases their nodulation competitiveness on certain host genotypes. New Phytologist 179, 495–504. - PubMed
    1. Astua-Monge G, Freitas-Astua J, Bacocina G, Roncoletta J, Carvalho SA, Machado MA. 2005. Expression profiling of virulence and pathogenicity genes of Xanthomonas axonopodis pv. citri . Journal of Bacteriology 187, 1201–1205. - PMC - PubMed
    1. Bae H, Herman E, Bailey B, Bae H-J, Sicher R. 2005. a . Exogenous trehalose alters Arabidopsis transcripts involved in cell wall modification, abiotic stress, nitrogen metabolism, plant defense. Physiologia Plantarum 125, 114–126.
    1. Bae H, Herman E, Sicher R. 2005. b . Exogenous trehalose promotes non-structural carbohydrate accumulation and induces chemical detoxification and stress response proteins in Arabidopsis thaliana grown in liquid culture. Plant Science 168, 1293–1301.

Publication types

MeSH terms